


Updated August 29, 2026
What is a Data Science Workflow?
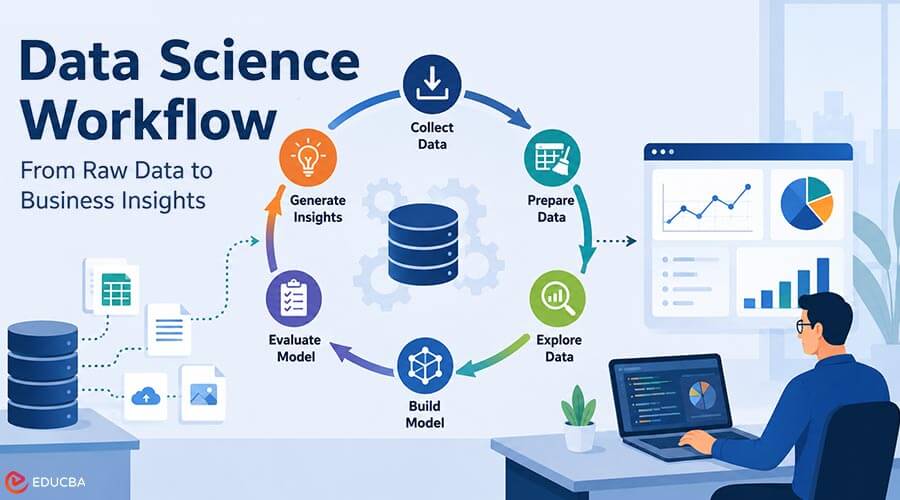
A data science workflow is a systematic process for gathering, preparing, analyzing, modeling, and interpreting data. It connects technical analysis to actual business objectives.
Businesses collect vast amounts of data from websites, apps, transactions, customer interactions, sensors, and social media. But raw data alone offers little value unless it is processed, analyzed, and turn it into useful insights. A data science workflow provides a clear, structured process for transforming scattered data into meaningful information that supports better business decisions.
It typically involves multiple interconnected stages:
Define Problem → Collect Data → Clean Data → Explore Data → Engineer Features → Build Model → Evaluate → Generate Insights → Deploy → Monitor
The process is not always linear. Data scientists often return to earlier stages when new findings reveal missing information, quality issues, or changing business requirements.
Table of Contents
- What is a Data Science Workflow?
- Key Stages of the Data Science Workflow
- Example of a Data Science Workflow
- Traditional Data Analysis vs. Data Science Workflow
- How is AI Changing the Data Science Workflow?
- Common Challenges
Key Stages of the Data Science Workflow
The key stages of the data science workflow are outlined below, covering each step from defining the problem to monitoring the final solution.
1. Define the Business Problem
A clear query is the first step in any successful data science project. Businesses should identify a specific issue that data can help resolve rather than asking, “What can be discovered from this data?”
For example, an online retailer might want to determine:
- Why customers abandon their shopping carts?
- Which customers are likely to stop purchasing?
- Which products should receive additional inventory?
- How promotions influence purchasing behavior?
A well-defined objective determines which data, analytical techniques, and success metrics are appropriate. For example, a customer retention project might use customer churn rate as its primary business metric. This connects the technical project directly to an organizational goal.
Start with the decision the business needs to make, rather than the data available. A focused objective helps prevent unnecessary analysis.
2. Collect Relevant Data
Once you set the objective, gather the right data. Data may come from internal and external sources, including:
- Customer relationship management systems
- Transaction databases
- Website analytics
- Mobile applications
- Social media platforms
- Surveys and feedback forms
- IoT devices and sensors
- Public datasets
- Third-party APIs
Quality is more important than quantity. If thousands of irrelevant records are gathered but do not solve the business problem, the model will not be improved. When gathering data, data scientists must also consider security, privacy, access rights, and legal obligations.
Prioritize information that directly advances the project’s goal. If the information is incorrect or useless, more data does not always translate into better outcomes.
3. Clean and Prepare the Data
Inaccurate entries, inconsistent formats, duplicate records, and missing values are frequently found in raw datasets. Data cleansing removes these issues before analysis starts.
Common data preparation activities include:
- Removing duplicate records
- Handling missing values
- Correcting inconsistent formats
- Identifying unusual observations
- Converting data types
- Standardizing categorical values
- Removing irrelevant variables
For instance, “USA,” “U.S.,” and “United States” can appear as distinct values in a customer dataset. By standardizing them, you avoid needless discrepancies during analysis. Because trustworthy models rely on trustworthy inputs, data preparation might take up a large amount of a data science effort.
Document major cleaning and transformation steps. This improves reproducibility and makes it easier to identify problems later in the workflow.
4. Explore the Data
Exploratory data analysis, or EDA, helps data scientists understand what the dataset contains. At this stage, analysts examine distributions, relationships, patterns, and unusual observations using statistical methods and visualization.
Common techniques include:
- Histograms
- Scatter plots
- Box plots
- Correlation analysis
- Summary statistics
- Grouped comparisons
Let us say a store examines sales every month. EDA may show that certain regions routinely outperform others or that sales rise dramatically during particular holidays. These results can influence future modeling choices and occasionally answer the business challenge without sophisticated machine learning.
When conducting exploratory analysis, look beyond clear patterns. Unexpected connections or odd findings might highlight data quality issues as well as important business opportunities.
5. Engineer Useful Features
Feature engineering involves transforming existing data into variables that provide greater value to analytical models. Consider an e-commerce customer dataset containing transaction dates and order values.
Instead of using those fields directly, data scientists could create:
- Average order value
- Purchase frequency
- Days since the last purchase
- Total spending
- Number of product categories purchased
These factors might offer stronger indications for forecasting consumer behavior. Both technical knowledge and subject-matter expertise are frequently necessary for effective feature engineering. Data scientists can find variables that computers might otherwise miss by thoroughly understanding how a firm runs.
Use domain knowledge when creating features. A technically sophisticated feature is useless if it does not represent a meaningful aspect of the business problem.
6. Build the Data Science Model
The next stage involves selecting an analytical or machine learning technique suited to the problem. Different objectives require different approaches.
| Business Objective | Common Approach |
| Predict Customer Churn | Classification |
| Forecast Future Sales | Regression or time-series forecasting |
| Group Similar Customers | Clustering |
| Detect Unusual Transactions | Anomaly detection |
| Recommend Products | Recommendation systems |
| Analyze Customer Reviews | Natural language processing |
The model learns from prepared data and identifies patterns to make predictions or classifications. However, the most complicated model is not automatically the best model. Businesses should prioritize accuracy, interpretability, scalability, cost, and practical usefulness.
Begin with a simple baseline model before testing more complex approaches. This gives you a useful benchmark for measuring whether added complexity provides real value.
7. Evaluate Model Performance
Evaluate a model before it influences business decisions. Data scientists typically divide datasets into training and testing portions. Some projects use validation sets or cross-validation to evaluate a model’s performance on unseen data. Evaluation metrics depend on the problem.
For classification, teams may examine:
- Accuracy
- Precision
- Recall
- F1-score
- Area under the ROC curve
For regression, common measures include:
- Mean absolute error
- Mean squared error
- Root mean squared error
- R-squared
Business metrics should also be considered. A model with high technical accuracy may have limited value if it does not improve revenue, reduce costs, or enhance customer experiences.
Never rely on a single performance metric. Compare multiple relevant metrics and consider the business impact of false positives, false negatives, or prediction errors.
8. Turn Results Into Business Insights
A prediction is not the final product of data science. The real value comes from explaining what the results mean and what decision should follow. For example, a model might identify customers with a high probability of churn. The business insight could be that customers who experience delayed deliveries and reduced engagement are more likely to leave. The organization can then create targeted retention campaigns for those customers.
Effective data storytelling should answer three questions:
What happened?
Identify the important pattern or result.
Why did it happen?
Explain the factors contributing to the outcome.
What should happen next?
Recommend a practical business action.
Connect every major finding to a potential business action. An accurate prediction becomes more valuable when decision-makers know how to use it.
9. Deploy the Solution
When a model performs satisfactorily, you can integrate it into a business application or operational workflow. For example, a recommendation model could be connected to an e-commerce website and generate personalized product suggestions whenever customers browse products.
Deployment may involve:
- Cloud platforms
- APIs
- Business dashboards
- Enterprise applications
- Automated data pipelines
- Machine learning platforms
The deployment environment should support security, scalability, reliability, and appropriate access controls.
Plan your deployment requirements ahead of time. Security, scalability, integration, and data availability can all affect model selection even before the solution goes into production.
10. Monitor and Improve the Model
A data science workflow does not end after deployment. Business conditions and customer behavior change over time. As a result, model performance can decline even when the underlying software continues operating correctly.
Teams should monitor:
- Prediction accuracy
- Data quality
- Model drift
- System performance
- Business outcomes
- Unexpected changes in input data
When performance declines, the model may need retraining or redesign. This creates an ongoing cycle of data collection, analysis, modeling, evaluation, deployment, and improvement.
Pro Tip:
Consider deployment as the start of continuous model management. Regularly compare real-world performance with expected outcomes to detect drift and decide whether to retrain.
Example of a Data Science Workflow
Consider a company experiencing declining customer retention. The data science team could follow this process:
- Define the problem: Identify customers likely to leave.
- Collect data: Gather purchase history, engagement, and customer-service records.
- Clean data: Remove duplicates and handle missing information.
- Explore data: Identify patterns associated with customer churn.
- Create features: Calculate purchase frequency and recent activity.
- Build a model: Train a classification algorithm.
- Evaluate performance: Test predictions using appropriate metrics.
- Generate insights: Identify high-risk customer groups.
- Take action: Launch personalized retention campaigns.
- Monitor results: Measure whether churn decreases.
This demonstrates how data science connects technical analysis with measurable business outcomes.
Traditional Data Analysis vs. Data Science Workflow
Although the two approaches overlap, they often serve different purposes.
| Aspect | Data Analysis | Data Science Workflow |
| Primary Focus | Understanding data | Solving broader data-driven problems |
| Typical Output | Reports and insights | Insights, predictions, and automated solutions |
| Methods | Statistics and visualization | Statistics, machine learning, AI, and programming |
| Automation | Limited to moderate | Often extensive |
| Deployment | Usually not required | Frequently required |
| Scope | Often descriptive | Descriptive, predictive, and prescriptive |
In practice, data analysis is often a key part of a broader data science workflow.
How is AI Changing the Data Science Workflow?
Artificial intelligence is increasingly influencing several stages of data science. AI-assisted tools can help teams:
- Generate SQL queries
- Explore datasets
- Identify potential anomalies
- Create visualizations
- Generate feature ideas
- Assist with code
- Summarize analytical findings
- Automate repetitive data preparation
- Build predictive models
But automation does not mean that human judgment is no longer necessary. Data scientists still have to verify findings, comprehend the business context, evaluate bias, safeguard confidential data, and decide whether conclusions make sense. Therefore, human expertise will likely coexist with increasingly powerful AI systems in the future of data science.
Common Challenges
Despite its potential, data science projects face several challenges.
- Poor data quality: Inaccurate or incomplete information can undermine analysis.
- Data silos: Important information may exist across disconnected systems.
- Unclear objectives: A technically impressive project may fail if it does not address a meaningful business problem.
- Model bias: Biased training data can produce unfair or unreliable predictions.
- Lack of adoption: Insights have limited value when decision-makers do not trust or understand them.
Overcoming these challenges requires collaboration among data scientists, engineers, business teams, and organizational leaders.
Final Thoughts
The data science workflow transforms raw information into a repeatable process for discovering patterns, generating predictions, and supporting business decisions. Each stage contributes to the outcome, from defining the initial problem to monitoring a deployed model. The most effective data science projects do more than produce accurate models.
They connect reliable data and analytical techniques with clear business objectives. When organizations make that connection successfully, data becomes more than a collection of records, it becomes a strategic asset that guides smarter, faster decisions.
Recommended Articles
We hope this guide to the data science workflow helps you turn raw data into meaningful business insights. Check out these recommended articles for more insights and strategies to strengthen your data-driven decision-making.