Updated July 12, 2023
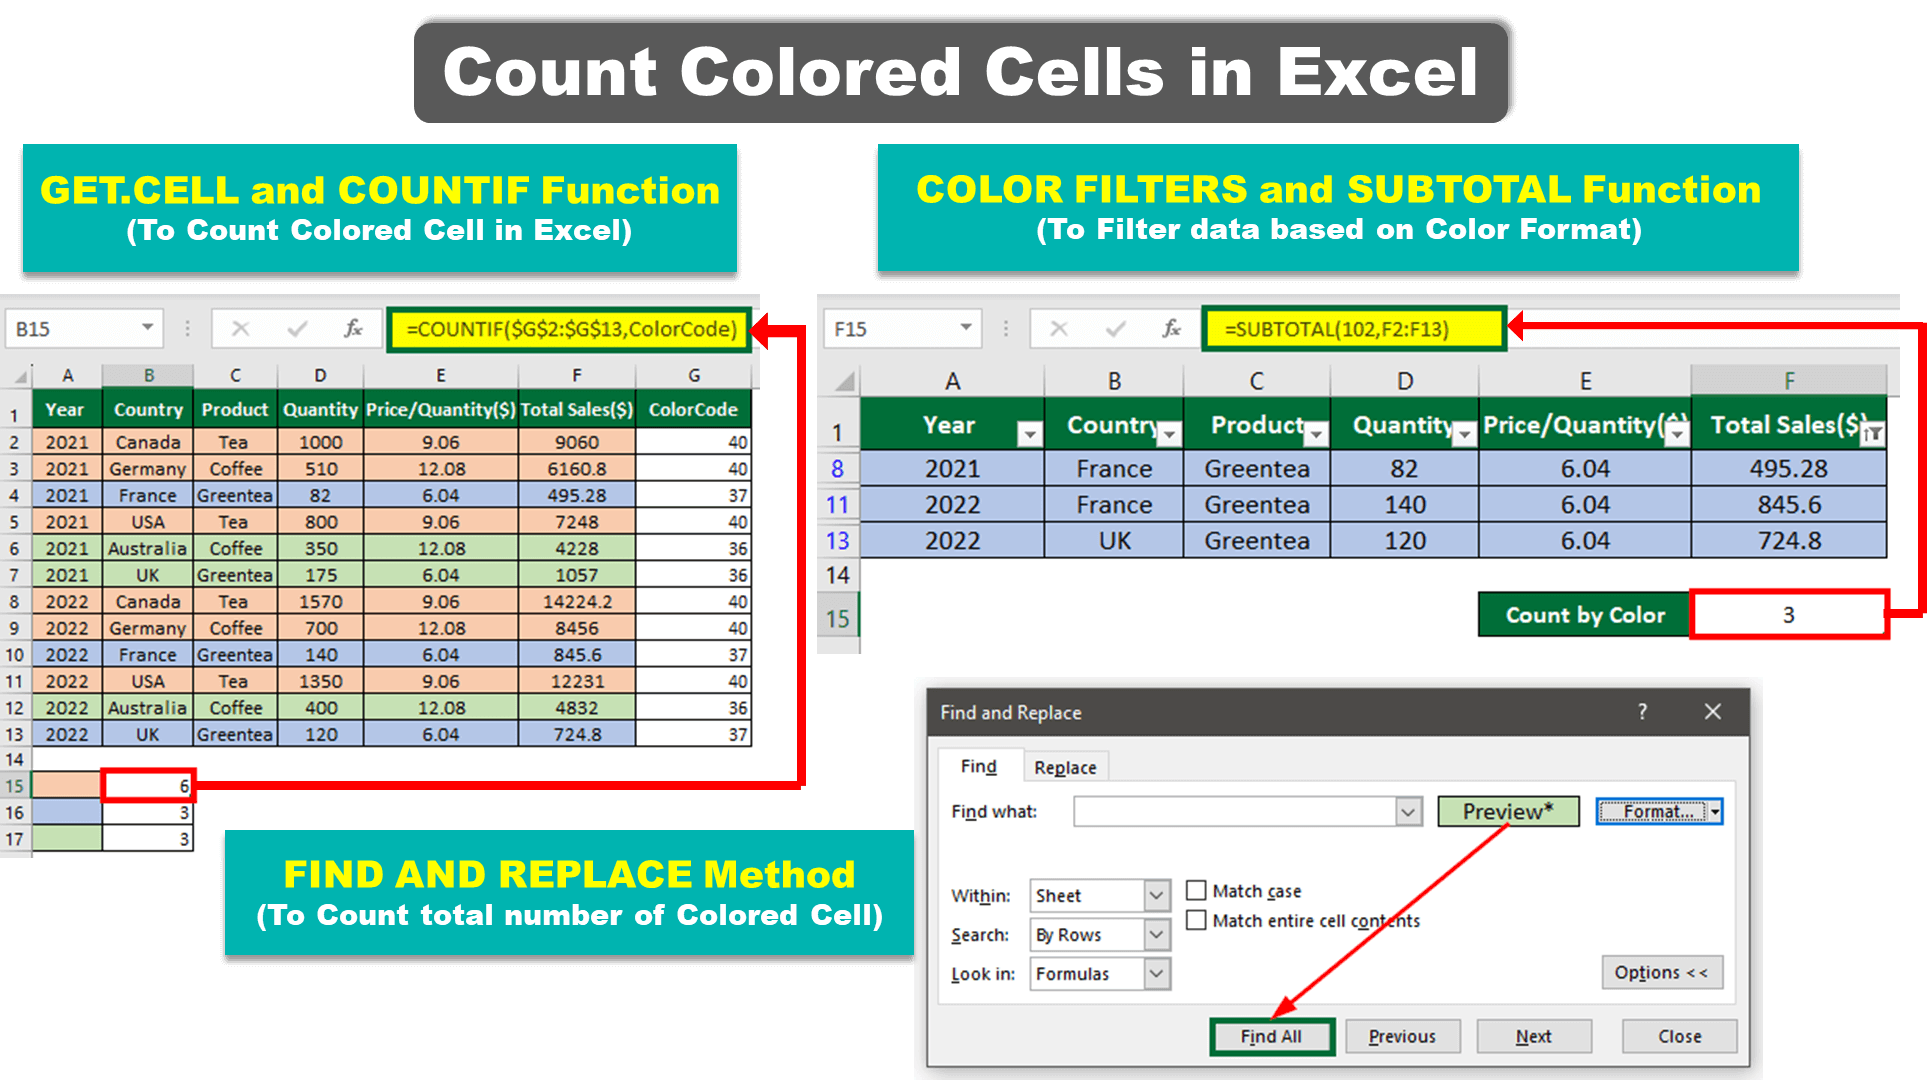
Table of Contents
- Example #1: Using the Find and Replace method
- Example #2: Using SUBTOTAL Formula and Color Filters
- Example #3: Using GET.CELL and COUNTIF Function
- Things to Remember to Count Colored Cells In Excel
Introduction to Count Colored Cells in Excel
Count Colored Cells in Excel, or formatting makes Cells organized, increases readability, and makes data presentable. For instance, if you have data from a sales report, you can highlight or color cells greater than $5000 in red and less than $5000 in green. It makes it easy to identify and categorize information in your data. However, there is no inbuilt function to count colored cells in Excel. The COUNT and COUNTIF functions count cells with numbers but do not count them based on their colors. To count colored cells in Excel, we can use a combination of different functions.
In this article, we have discussed three methods to count colored cells in Excel as follows:
- Using the Find and Replace Method
- Using the SUBTOTAL Formula and Color Filters
- Using GET.CELL and COUNTIF Function
How to Count Colored Cells in Excel?
Let’s understand how to Count Colored Cells in Excel with a few examples.
Example #1: Find and Replace Method
It is the simplest way to count colored cells in Excel. Let’s consider the following example to understand how to count cells using this method.
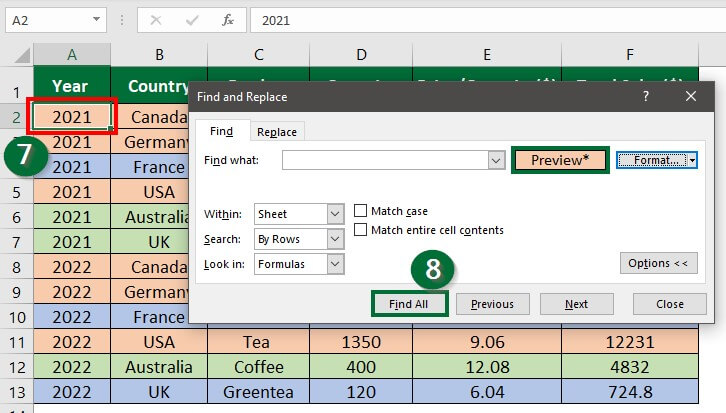
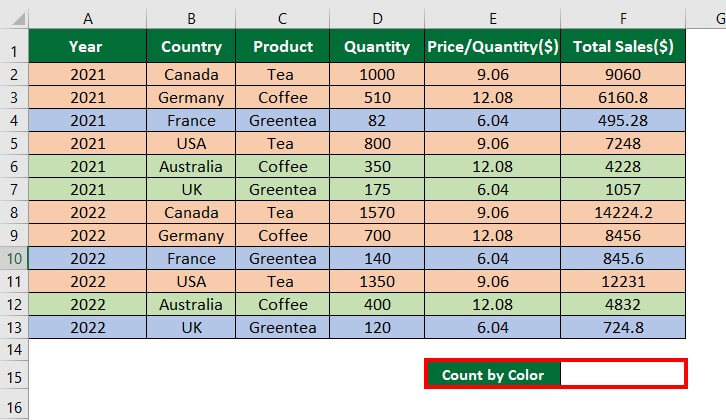
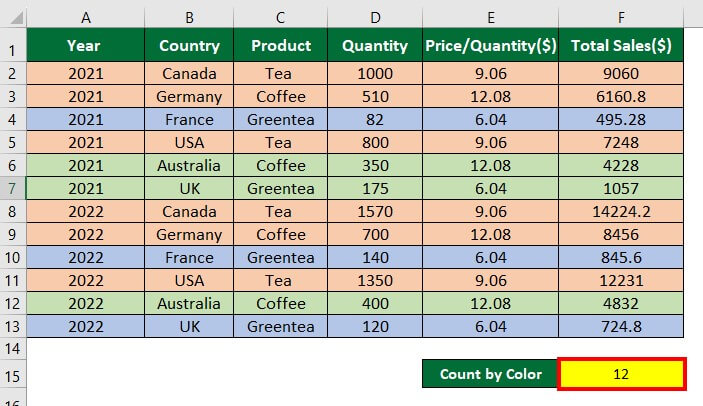
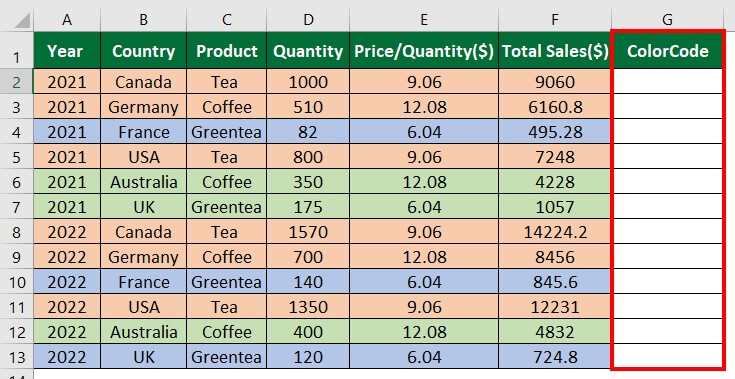
As an entrepreneur exporting tea, coffee, and green tea to multiple countries (Canada, Germany, France, USA, Australia, and the UK), you have sales data for 2021 and 2022. The data is color-coded, with pink representing total sales over $5000, green indicating sales between $1000 and $5000, and blue indicating sales below $1000. You want to calculate the total sales greater than $5000.

Solution:
Step 1: Select the data.
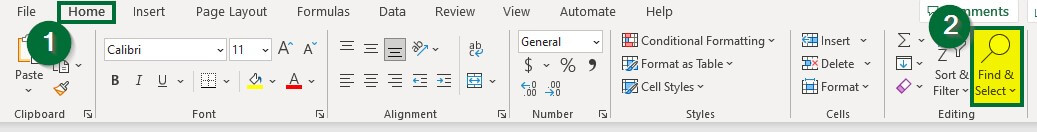
Step 2: In the “Home” tab, select the “Find and Select” option under the “Editing” group.
Step 3: Select “Find“, as shown below.
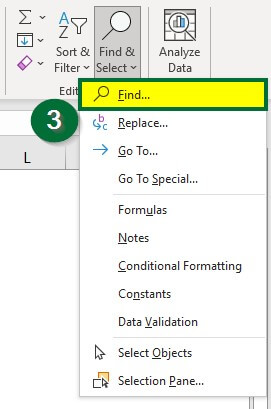
A dialog box of “Find and Replace” will open up.
Step 4: Click “Options” under the “Find” tab, as shown below.
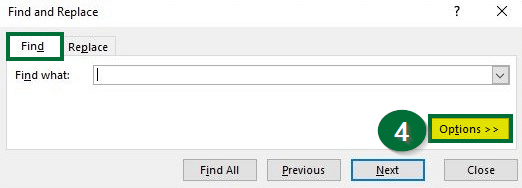
Step 5: Click on the drop-down menu (highlighted in the below image) of the “Format” option.
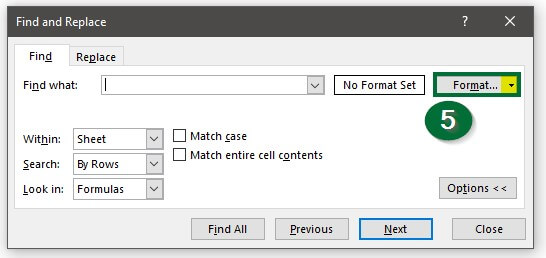
Step 6: Select “Choose Format From Cell“, as shown below.
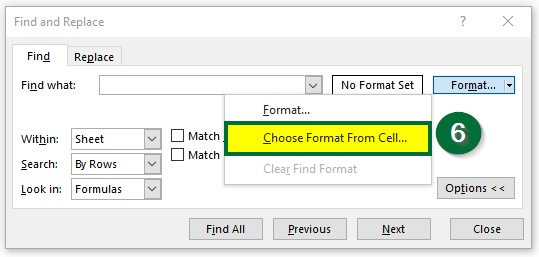
An eye-dropper symbol will appear after selecting the Choose Format From Cell option. Now, move this eye-dropper to the cell (with color) you want to count. In our case, it is Cell A2.
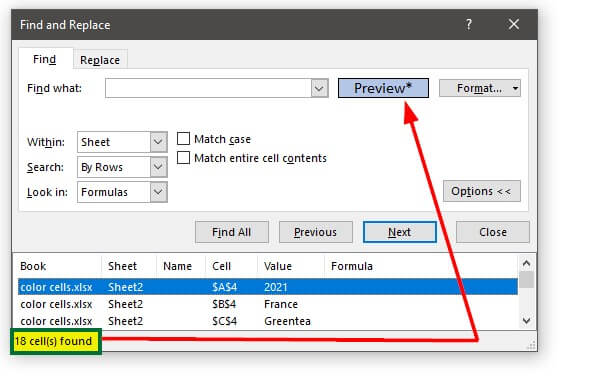
Step 7: Select “Cell A2″. After selecting Cell A2, the “Find and Replace” dialog box preview option will show the selected cell’s color.
Step 8: Press “Enter“.
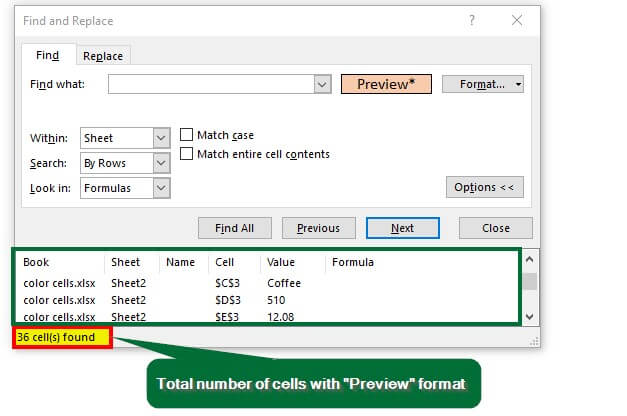
Similarly, if you want to know the total number of cells for the blue color, follow the above steps.
The dialog box will show the total count for the blue color, as shown below.
Example #2: SUBTOTAL Formula and Color Filters
To display and sum colored cells with a specific format in Excel, you can utilize the SUBTOTAL and COUNTIF functions.
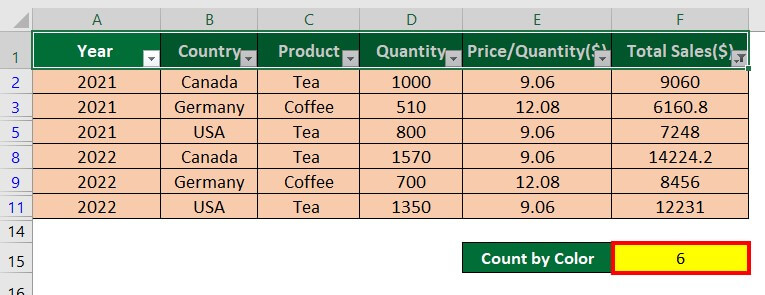
For example, you want to display data where the total sales exceed $5000 (represented by cells with pink color).
Solution:
1. calculate the total number of cells using the SUBTOTAL function.
Step 1: Select “Cell F15″ and enter the formula:
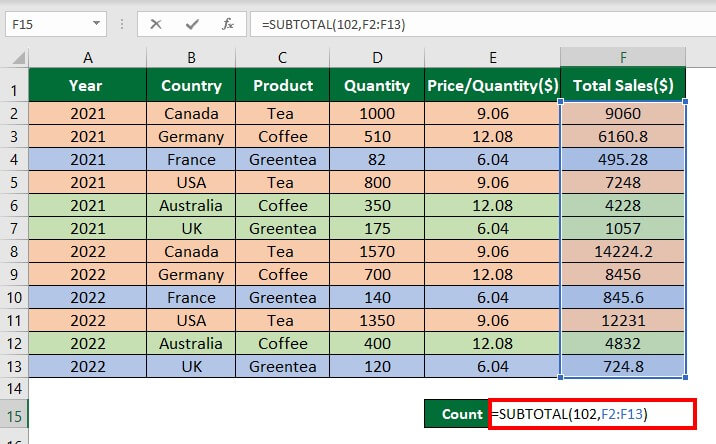
Step 2: Press “Enter“.
The formula will display 12, the total count of cells with all colors.
2. Now, we will add filters to the data to count the pink color.
Step 1: Select the headers of the data, and Go to “Data”> Click on “Filter” under the “Sort & Filter” group.
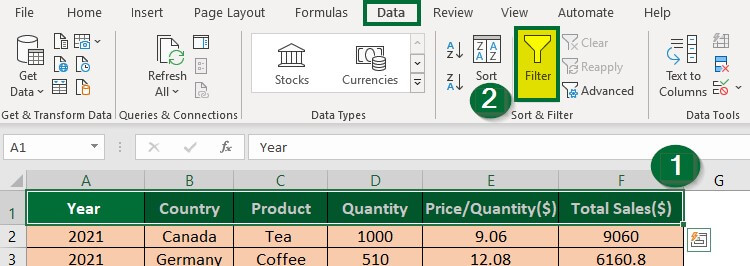
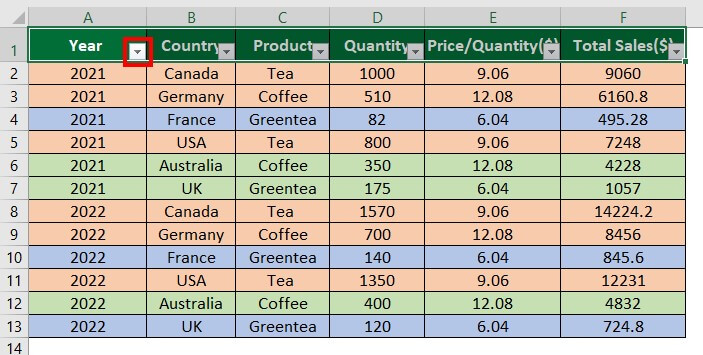
As shown below, the filter option is applied to all the headers.
Step 2: Select the filter icon, click “Filter by Color”, and choose the color you want to count. In our case, choose the pink color.
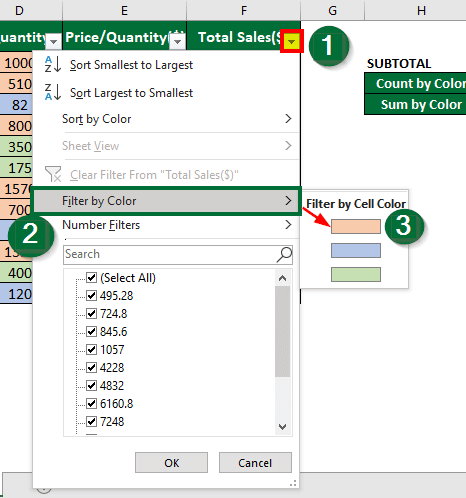
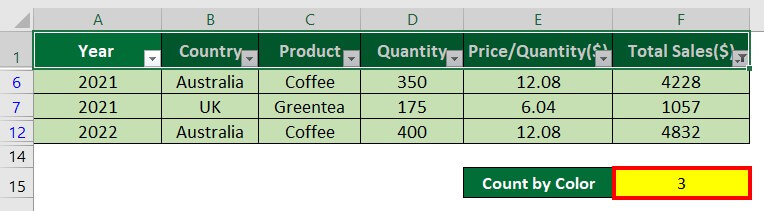
Similarly, you can count cells with green color (total sales between $1000 and $5000), as shown in the following image.
Example #3: GET.CELL and COUNTIF Function
The GET.CELLS function in Excel, which specifically works with named ranges, is useful for counting colored cells. It provides the color code for highlighted or colored cells in the data. You can count the number of cells with the same color by combining the GET.CELL function with the COUNTIF function.
Let’s learn how to use these functions to count colored cells.
Solution:
Step 1: Insert the column “ColorCode” beside the “Total Sales”, as shown below.
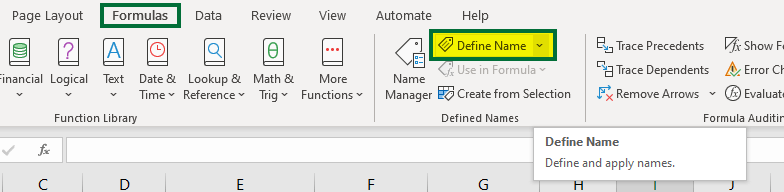
Step 2: Go to the “Formulas” tab and click “Define Name”.
A “New Name” dialog box will appear.
Step 3: Type “ColorCode” in the “Name” section and enter the below formula in the “Refers to”:
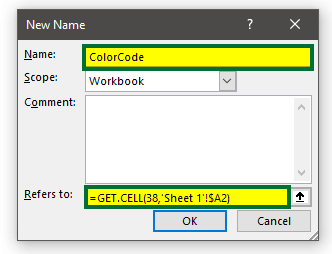
Formula Explanation: =GET.CELL(38,’Sheet 1′!$A2)
In this formula:
- 38 represents the cell code that specifies the color.
- ‘Sheet 1’ refers to the sheet number where the cell with the desired color format is present.
- $A2 represents the column cell value of Sheet 1 with the color format.
This formula will assign the color of cell A2 in Sheet 1 a specific number known as the ColorCode.
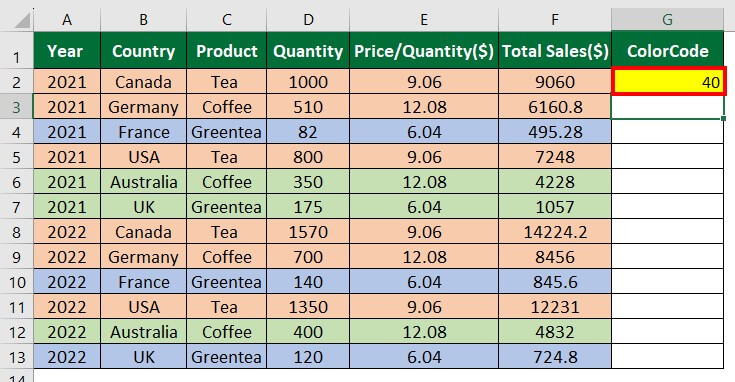
Step 4: Select “Cell G2” and enter “=ColorCode”.
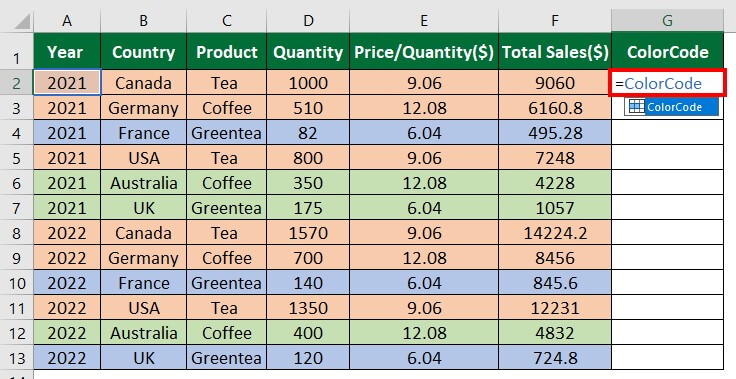
Step 5: Press “Enter“.
The formulas have assigned 40 for the pink color.
Step 6: Drag the “Cell G2” downwards.
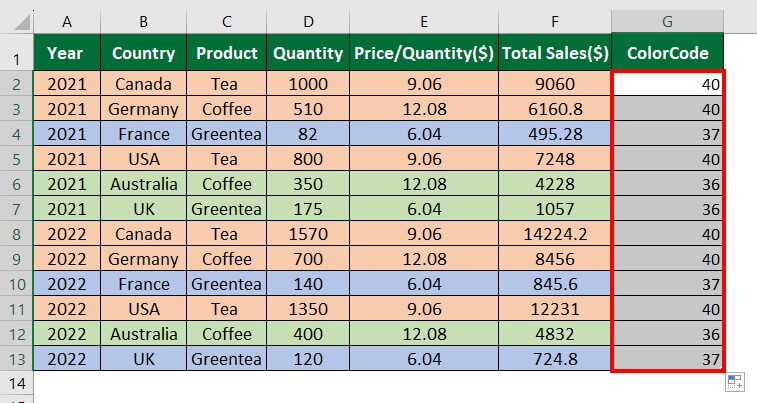
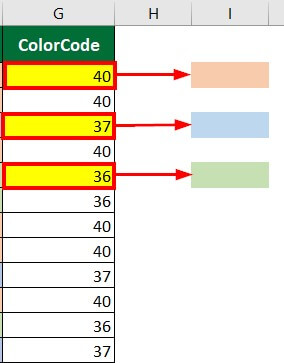
In this case, the formula assigns 40, 37, and 36 to represent pink, blue, and green colors, respectively.
Now, let’s calculate the total count for each colored cell using the ColorCode and COUNTIF functions.
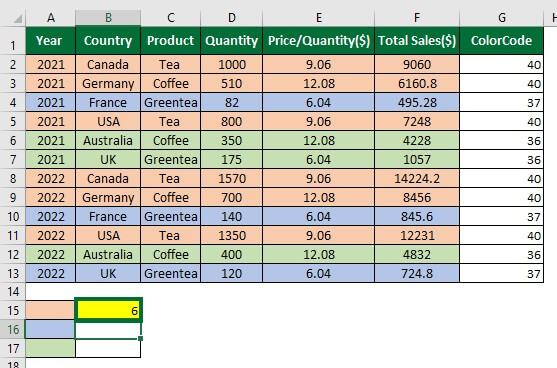
Step 7: Select “Cell B15″ and enter the formula:
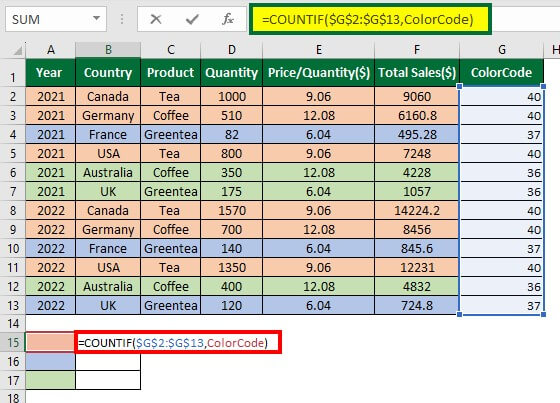
Step 8: Press “Enter.”
The COUNTIF function will display 6, i.e., the total number of cells in pink.
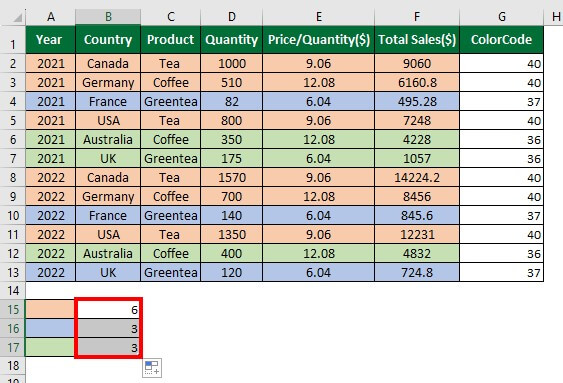
Step 9: Drag the AutoFill handle to apply the COUNTIF formula to other cells.
Things to Remember About Count Colored Cells In Excel
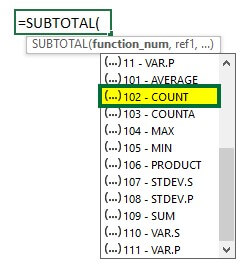
- In the SUBTOTAL function, use the 102 function operator to count all cells with the specified color and 109 to sum all the cells.
- The keyboard shortcut to add or remove filters from the data is “Ctrl + Shift + L”.
- The filters option in Excel is not dynamic. If you make any changes in the data, like changing the color format or adding or deleting data in the table, you must reapply the filters option.
- The GET.CELL function uses the Macro4 legacy function, which sometimes cannot be supported by Microsoft.
- When applying to GET.CELL function in Excel worksheet, save the file in the xlsm macro to enable format.
Recommended Articles
This article provides a step-by-step guide on counting colored cells in Excel using the top three methods with practical examples. We have also provided a downloadable Excel template. You can also read our other articles below to learn about Excel features.
