Updated August 23, 2023
CORREL in Excel
The correl function in Excel is used for calculating the Correlation Coefficient, whose value ranges from -1 to +1 only, and it also shows how strongly any 2 values are related. The range for the correlation coefficient is only -1 to +1, which is quite small, and the value falling under this range will be less compared to any other number. As per the syntax, we just need to select the 2 arrays of numbers for which we need to find the Correlation Coefficient.
Correlation Coefficient
It’s a statistical measure of how strong a relationship is between two variables, i.e., for a positively correlated variable, the Correlation coefficient value increases. In contrast, for a negatively correlated variable, the Correlation coefficient value decreases.
Correlation coefficients express values between +1 and -1.
I have two variables (one plotted on the X-axis, one on the Y-axis)
- If the value is 1, then it means a strong positive correlation. In this case, y increases when x increases (Positive linear relationship)
- If the value is 0: means that there is no relationship between the two variables (x and y)
- If the value is -1, then it means a negative correlation: In this case, y decreases when x increases (Negative linear relationship)

Definition
CORREL Function: Returns the correlation coefficient between two datasets or variables
CORREL Formula in Excel
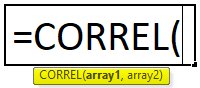
Below is the CORREL Formula:
Where
Array1– It is an independent variable. It is entered as a cell reference or range of values.
Array2– It is a dependent variable. It is entered as a second cell reference or range of values.
Correlation coefficients are expressed as values between +1 and -1.
A coefficient of zero indicates, No discernable relationship between fluctuations of the variables.
It is most commonly used to Calculate the correlation coefficient for two sets of values or variables, i.e., the Correlation between a particular stock or share price and the market index value.
To Calculate the correlation coefficient for refrigerators & air conditioner sales in the summer & winter seasons and Car models, their year of launch & price difference.
Excel Correl function is similar to Pearson Function
CORREL function is used as a worksheet function & also in Excel VBA.
CORREL function in Excel is easy to use & is a very simple function with few arguments
How to use CORREL Function in Excel?
CORREL Function is very simple to use. Let us now see how to use the CORREL function in Excel with the help of some examples.
Example #1
For a Set of Positive Variables or Dataset
With the help of the Correl function, I need to find the correlation coefficient between two datasets or variables.
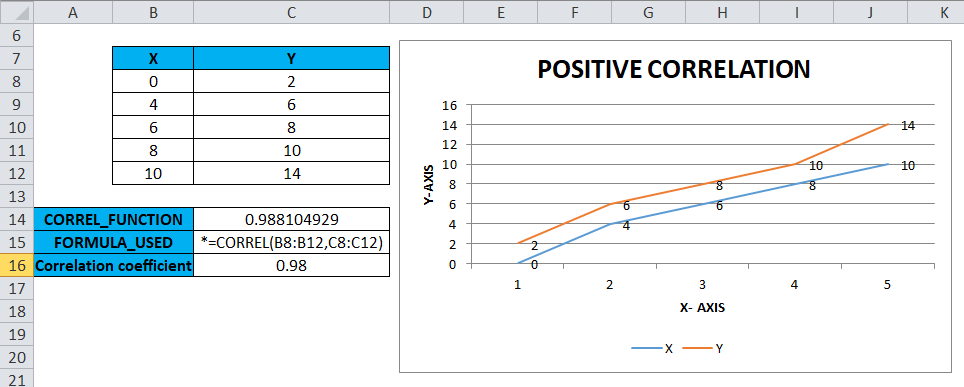
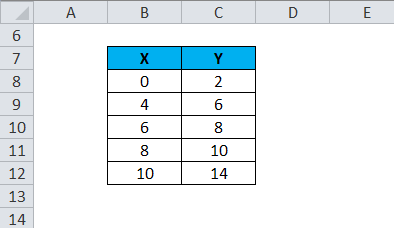
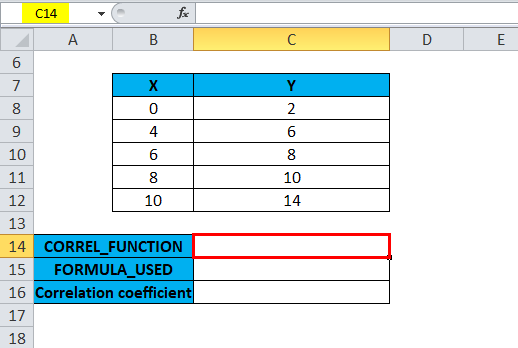
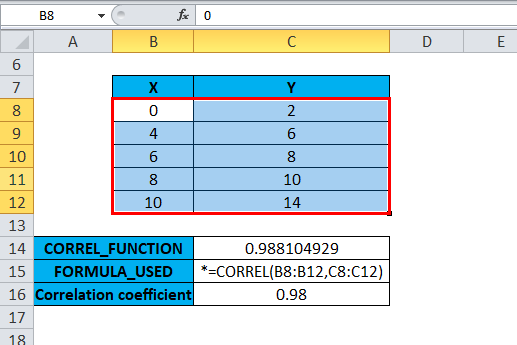
In the below-mentioned example, the table contains two variables, one in column X & the other in column Y. where both the datasets contain positive values.
Let’s apply the Correl function in cell “C14”. Select the cell “C14,” where the Correl function needs to be applied.
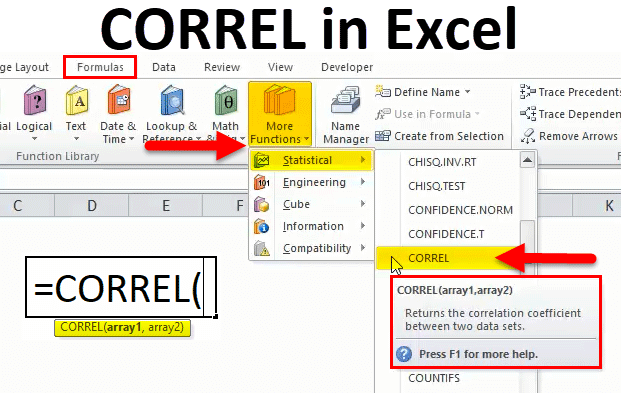
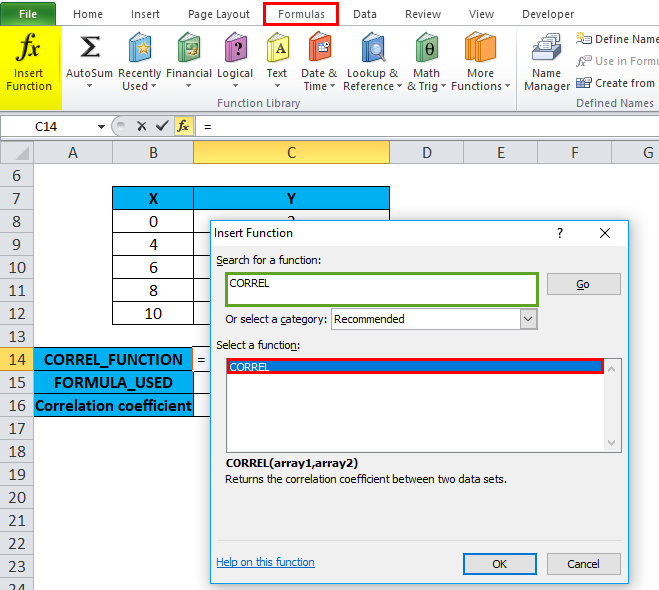
Click the insert function button (fx) under the formula toolbar; the dialog box will appear, type the keyword “CORREL” in the search for a function box, CORREL function will appear in the select function box. Double click on the CORREL function.
A dialog box appears where arguments for the CORREL function need to be filled or entered, i.e., =CORREL(array1, array2)
For the Array1 argument, click inside cell B8, and you’ll see the cell selected, then Select the cells till B12. So that column range will get selected, i.e., B8:B12
Similarly, For the Array2 argument, click inside cell C8 to see the cell selected, then Select the cells till C12. So that column range will get selected, i.e., C8:C12
i.e. =CORREL(B8:B12,C8:C12) will appear in cell C14
Click ok after entering both arguments.
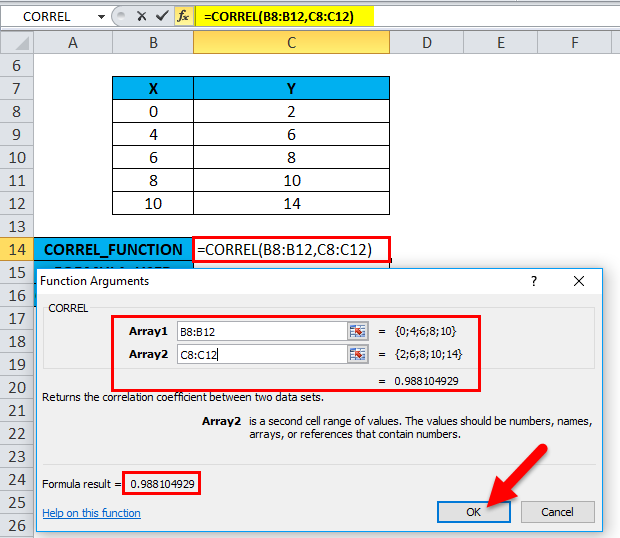
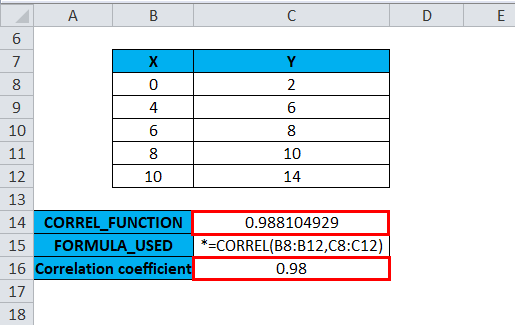
i.e. =CORREL(B8:B12,C8:C12) returns 0.988104929 as the result. The Correlation coefficient between the two datasets or variables is 0.98
To use a line chart for graphical representation, choose the chart option for “line chart”. It will allow you to represent data using a line chart visually.
I have two variables, X & Y, where one is plotted on the X-axis and the other one on the Y-axis.
Select the table range excluding header X & Y, i.e., B8 TO C12
Then click on the Insert tab; under that, select line options. Select the first one in the line chart option.
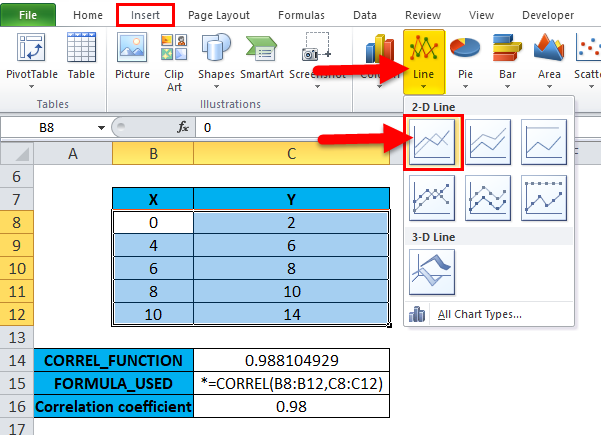
It will result in a chart,
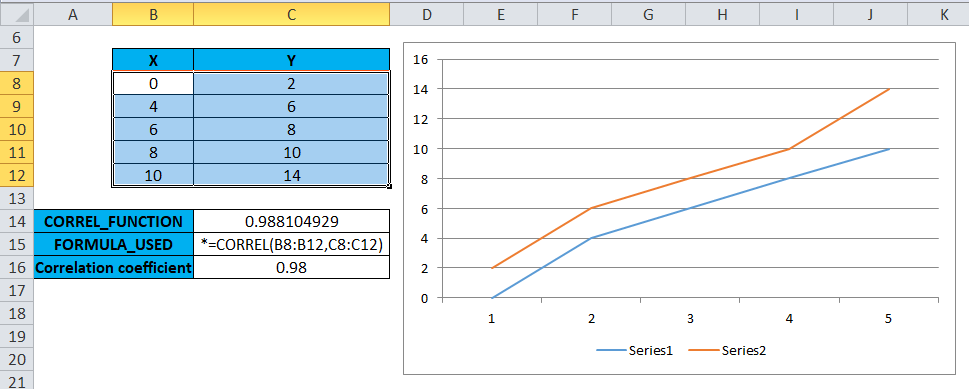
Chart elements such as legend series (X, Y) axis title (X & Y axis), chart title (POSITIVE CORRELATION) & data label (Values) need to be updated in the chart.
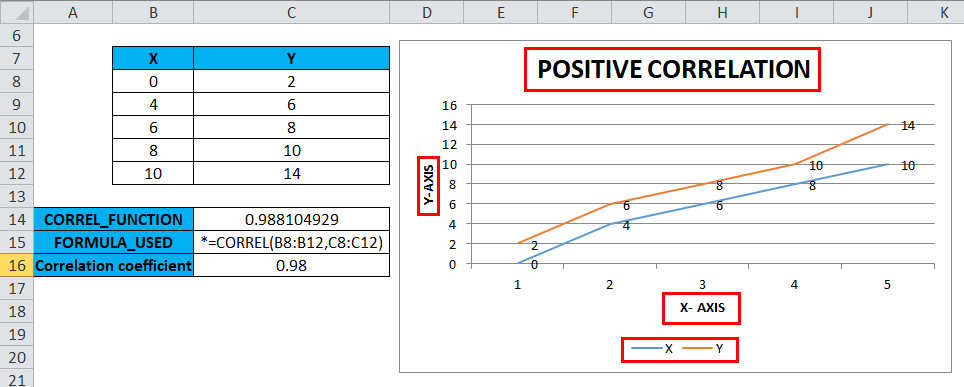
You can see a strong positive correlation, i.e., Variables X & Y values are positively correlated (Positive linear relationship)
Example #2
For a Dataset Containing Positive & Negative Values
With the help of the Correl function, I need to find out the correlation coefficient between two datasets or variables
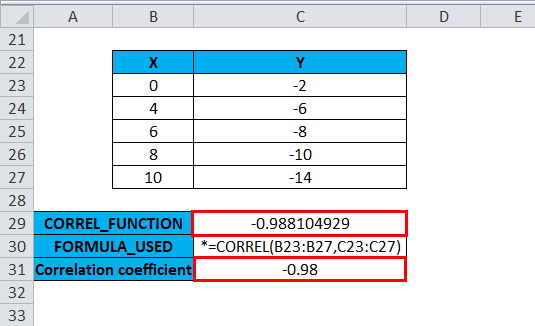
In the below-mentioned example, I have two variables, one in column x & the other in column Y. where column X datasets contain positive values & column Y datasets contain negative values
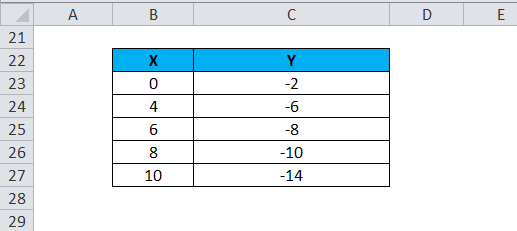
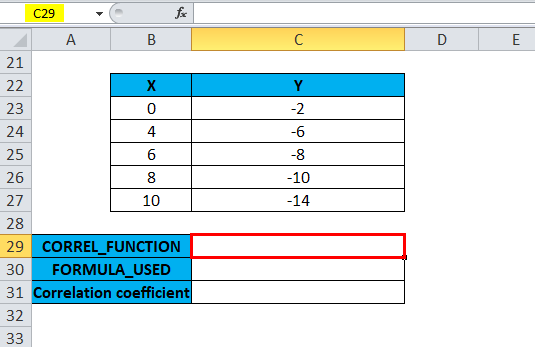
Let’s apply the Correl function in cell “C29”. Select the cell “C29,” where the Correl function needs to be applied.
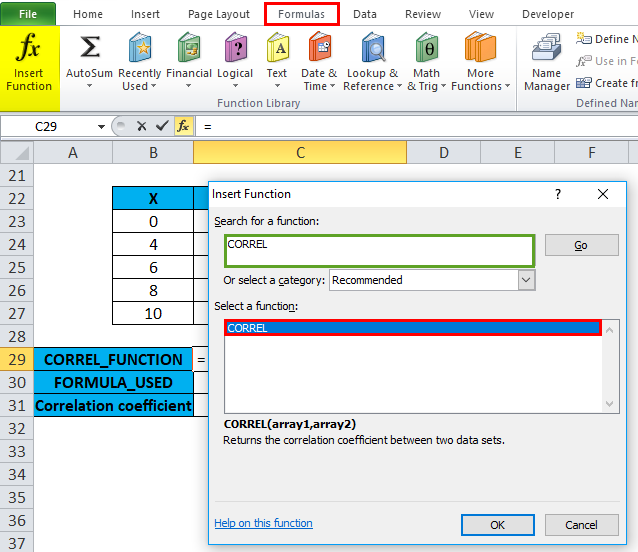
Click the insert function button (fx) under the formula toolbar; a dialog box will appear, type the keyword “CORREL” in the search for a function box, and the CORREL function will appear in the select function box. Double-click on the CORREL function.
A dialog box appears where arguments for the CORREL function need to be filled or entered, i.e., =CORREL(array1, array2)
For the Array1 argument, click inside cell B23, and you’ll see the cell selected, then Select the cells till B27. So that column range will get selected, i.e., B23:B27
Similarly, For the Array2 argument, click inside cell C23 to see the cell selected, then Select the cells till C27. So that column range will get selected, i.e., C23:C27
i.e. =CORREL(B23:B27,C23:C27) will appear in the cell C29
Click ok after entering both arguments.
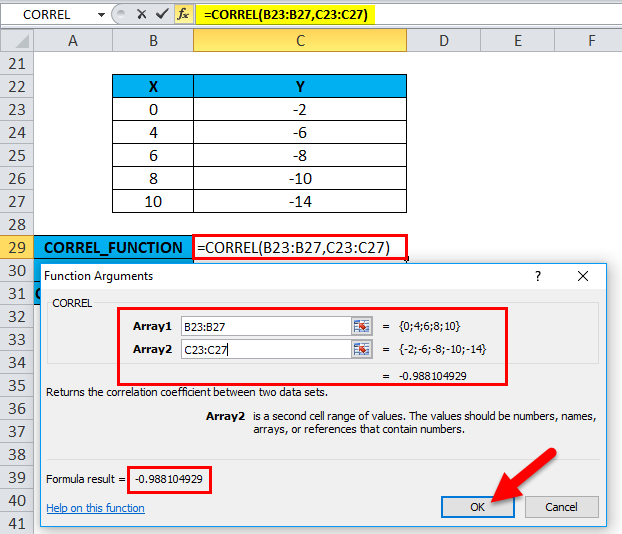
i.e. =CORREL(B23:B27,C23:C27) returns -0.988104929 as the result. The Correlation coefficient between two datasets or variables is -0.98
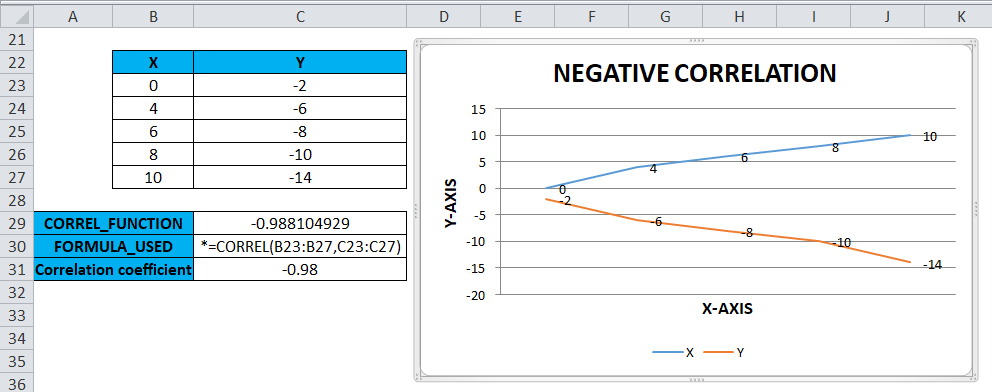
Similar to the above example, it graphically represents using a line chart under chart options
I have two variables, X & Y, where one plot on the X-axis, the other one on the Y-axis
You can see the negative correlation, i.e., Variables X & Y values are negatively correlated (Negative linear relationship). In this case, y decreases when x increases.
Things to Remember
- Suppose Array1 and Array2 have a different number of data points or if the supplied arrays are of different lengths. CORREL results in or returns the #N/A error value.
- The function will return the #DIV/0! Error value if the argument array1 or array2 contains non-numeric data (text, logical values, or blank cells).
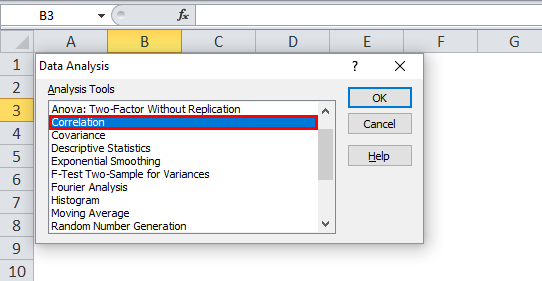
- The other method of calculating the correlation coefficient is through the Data analysis option. In the Excel toolbar, the data analysis tab is selected under the data ribbon; therefore, once we click on data analysis, a Data analysis popup will appear; we have to select correlation in that dropdown of analysis tools to calculate the correlation coefficient for given datasets or variables.
- It’s an inbuild Analysis Toolpak Add-in which is present in application add-ins.
Recommended Articles
Although this has been a guide to the Excel CORREL function. Therefore, here we discuss the CORREL Formula and how to use the CORREL function in Excel, along with practical examples and a downloadable Excel template. Thus, you can also go through our other suggested articles –
