Calculating Investment Return In Excel
Investment return, or majorly called Return on Investment (in short ROI), is the basic mathematical and financial calculation we all have done in our earlier times in School. But we have not tried this on Excel. Calculating Investment Return In Excel is the way to determine how much or the percentage returns the investor will receive based on the amount being invested for the given time period. There are different ways to find the investment return or ROI depending on our input type. We’ll explore this in the examples and descriptions below, using the ROI Calculator template.
How to Use Calculating Investment Return In Excel?
Considering the mathematical expression of calculating Return on Investment (ROI), we have different ways to find it. But the most widely used method for finding ROI is shown below. Return on Investment can be the amount gained from the market, or it can be the percentage by which we have gained the investment using the below formulas;
ROI = (Final Invested – Investment Amount)/ Investment Amount
ROI % = (Final Invested – Investment Amount)/ Investment Amount x 100
Where, Investment Amount – As clear the amount which is an investment into scheme or business
Final Invested – Amount being raised with a certain percentage
The first formula shown is the basic formula by which we can get the amount raised after the investment and another formula will give us the Return on Investment in percentage which is more precise.
Examples
Example #1 – Calculating Investment Return In Excel
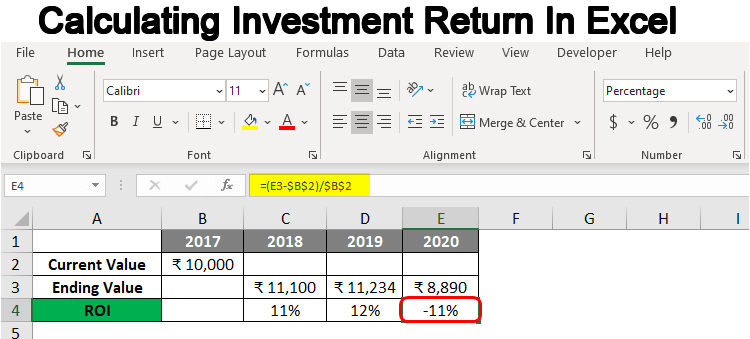
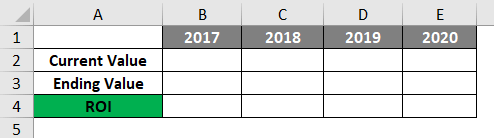
In this example, we will see one of the simplest ways to calculate Return on Investment of Investment Return. For this, we have considered simple sets of columns where we will calculate the ROI for the invested amount in 2017 to the investment return in 2018, 2019, and 2020 respectively, as shown below.
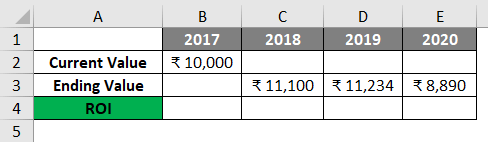
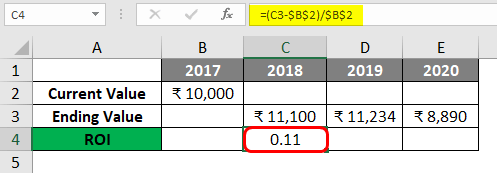
Let’s consider the invested amount in the year 2017 is Rs. 10,000/- for which we got the ending value or final return as shown below in respective year columns.
To calculate the ROI or Investment return of the investment in the year 2018, we need to follow the formula which we have seen above. Here are invested amount will be Rs. 10000/- and the final amount will be Rs. 11100/-. Now let’s put these values into the formula in cell C4 as shown below.
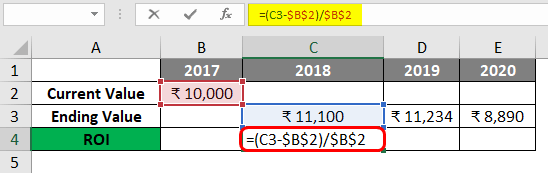
It is better to fix the cell of the Current Value because this will be seen in all the other ROIs of 2018-2020, as shown above. Now we will press enter to exit, this will show the ROI.
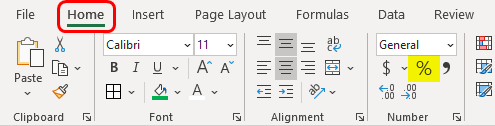
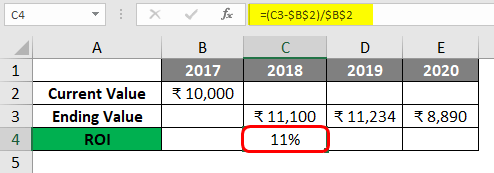
To convert this into a percentage, click on the % symbol from the Home menu tab, as shown below.
As we can see, the final percentage rate of return is coming at 11% for the year 2018.
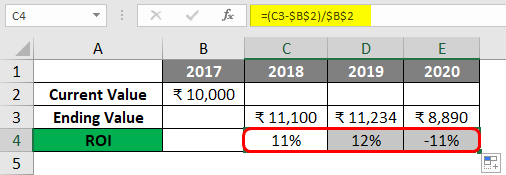
Now we will drag this formula to other side cells to calculate the ROI of 2019 and 2020. The ROI of 2019 is coming 12%, and of 2020 is coming as -11%. This means that investor is getting profit in the year 2018 and 2019 & loss in the year 2020.
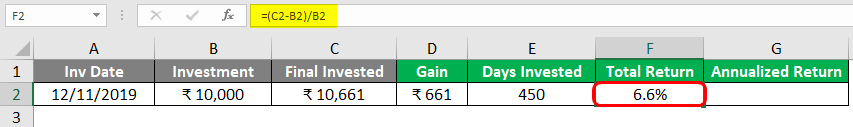
Example #2 – Calculating Investment Return In Excel
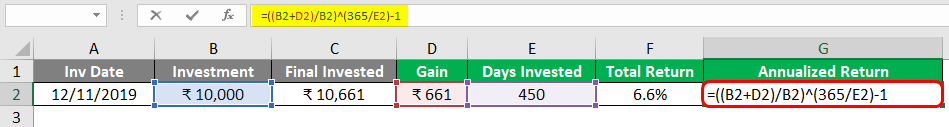
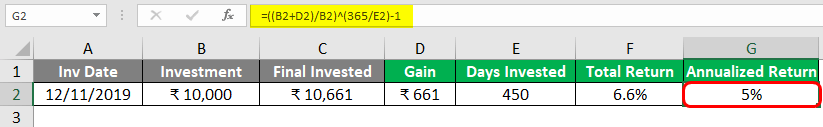
In this example, we will see how to calculate ROI and Annualized return using the formula below. To calculate the annualized return, we will be using the below formula.
R= ((Invest Amount + Gain)/Invest Amount)^(365/Days)-1
We have a different set of data as shown below.
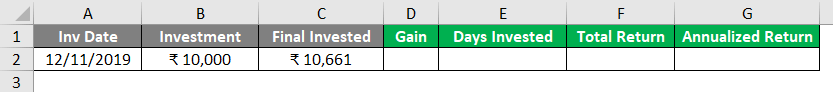
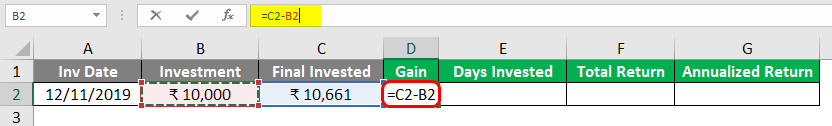
First, let’s find the gain in investment, which is the difference between Investment and final investment.
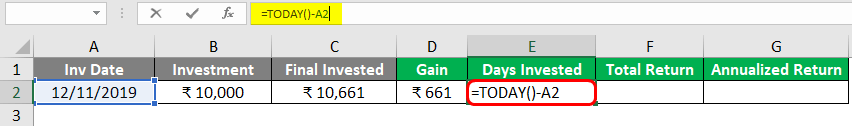
We can then calculate the days invested using the TODAY function with Investment date there in cell A2.
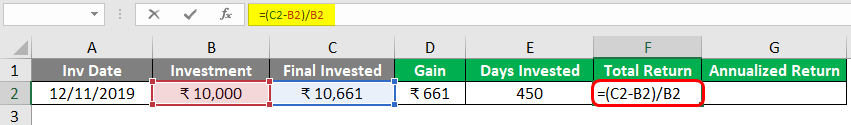
Now using the formula we have seen in example-1, as shown below. This would get us the %age ROI.
Calculate the Annualized Return, our final ROI for the year (considering 365 Days). Using the formula, first, add Invested amount and Gain and divide the sum with an Invested amount to calculate the whole ROI. And then, give it the power of 365 days of the year, divide it using the days invested, and subtract it by 1 to get the final value.
Pros of Calculating Investment Return In Excel
- All the methods shown in the above examples are very easy to implement.
- Better calculating ROI is by using the mathematical formula we have seen in the above examples and then implementing them in Excel.
Things to Remember About Calculating Investment Return In Excel
- ROI and ROI Percentage are both different. ROI is the value or amount gained or lost in the time interval, and ROI Percentage shows the exact reference value by which change is observed.
- Annualized Return helps us to calculate the ROI through the year or better we say at the end of the year.
- Fixing the cells when moving and pasting the formula into different cells is better. It helps in keeping the right formula value in the cell.
- We also have different methods in statistics that are not bound to the methods we have seen in the above examples.
Recommended Articles
This is a guide to Calculating Investment Return In Excel. Here we discuss the definition, How to Use Calculating Investment Return In Excel? Excel template. You may also have a look at the following articles to learn more –
