Updated March 4, 2023

Introduction to Butterworth filter Matlab
The following article provides an outline for Butterworth filter Matlab. Butterworth filter is used extensively in various RF and generic filter applications to get maximally flat output within the defined passband. Butterworth filter is considered as an all-round form of a filter which is adequately useful for various applications, even though it does not give the sharpest output or cut-off. When compared with other filters such as Chebyshev, the Butterworth filter tends to reach its final roll-off rate very slowly, which is also the basis of Butterworth filter, stating that the behaviour below cut-off frequencies are more important than at any other frequency.
In Matlab we use ‘butter’ command for the purpose of implementing ‘butterworth’ filter.
Syntax:
[y, x] = butter(n, F)
[y, x] = butter(n, F, Ftype)
Description:
- [y, x]: butter(n, F) is used to return the coefficients of transfer function for an nth-order digital Butterworth filter. This is a lowpass filter with a normalized cut off frequency of F.
- [y, x]: butter(n, F, Ftype) is used to design any of the highpass, lowpass, bandpass, bandstop Butterworth filter. The type of filter designed depends on cut off frequency and on Ftype argument.
Examples of Butterworth filter Matlab
Given below are the examples of Butterworth filter Matlab:
Example #1
In this example, we will create a Low pass butterworth filter:
For our first example, we will follow the following steps:
- Initialize the cut off frequency.
- Initialize the sampling frequency.
- For this example, we will create the Low pass butterworth filter of order 5.
- Next, we will use the filter created in above steps to filter a random signal of 2000 samples.
Code:
F = 300
[Initializing the cut off frequency to 300]Fs = 1000
[Initializing the sampling frequency to 1000] [y, x] = butter(5, F/(Fs/2)) [Creating the butterworth filter of order 5]inputSignal = randn(2000, 1);
[Creating a random signal of 2000 samples]outSignal = filter(y, x, inputSignal);
[Passing the input signal as an input to the butterworth filter created]plot(outSignal)
[Plotting the output of the butterworth filter]Input:
F = 300

Fs = 1000

[y, x] = butter(5, F/(Fs/2))

inputSignal = randn(2000, 1);

outSignal = filter(y, x, inputSignal);

plot(outSignal)
Output:
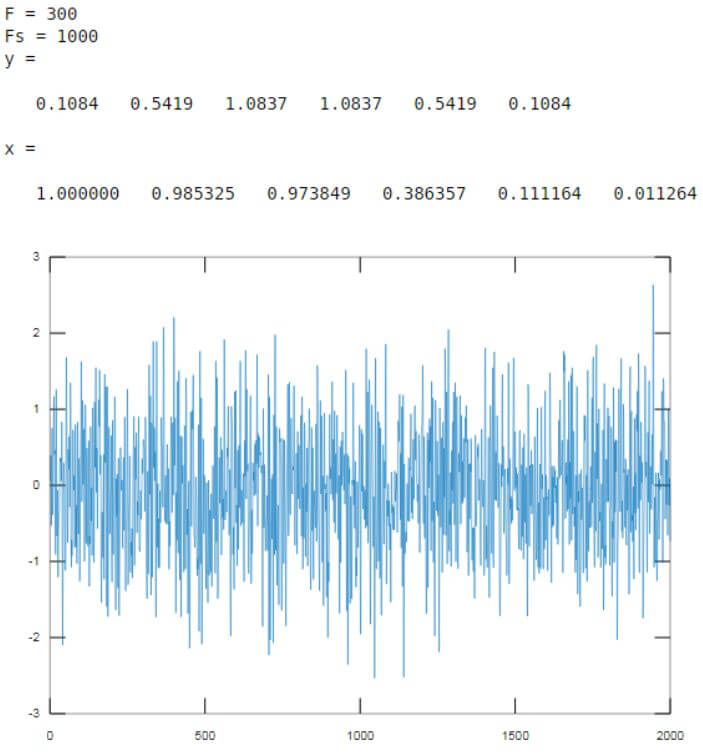
As we can see in the output, using a low pass butterworth filter we are able to filter the signal of 2000 random samples.
Example #2
In this example, we will create another Low pass butterworth filter:
For this example, we will follow the following 4 steps:
- Initialize the cut off frequency.
- Initialize the sampling frequency.
- For this example, we will create the Low pass butterworth filter of order 7.
- Next, we will use the filter created in above steps to filter a random signal of 3000 samples.
Code:
F = 600
[Initializing the cut off frequency to 600]Fs = 1000
[Initializing the sampling frequency to 1000] [y, x] = butter(7, F/(Fs/1)) [Creating the butterworth filter of order 7]inputSignal = randn(3000, 1);
[Creating a random signal of 3000 samples]outSignal = filter(y, x, inputSignal);
[Passing the input signal as an input to the butterworth filter created]plot(outSignal)
[Plotting the output of the butterworth filter]Input:
F = 600

Fs = 1000

[y, x] = butter(7, F/(Fs/1))

inputSignal = randn(3000, 1);

outSignal = filter(y, x, inputSignal);

plot(outSignal)
Output:
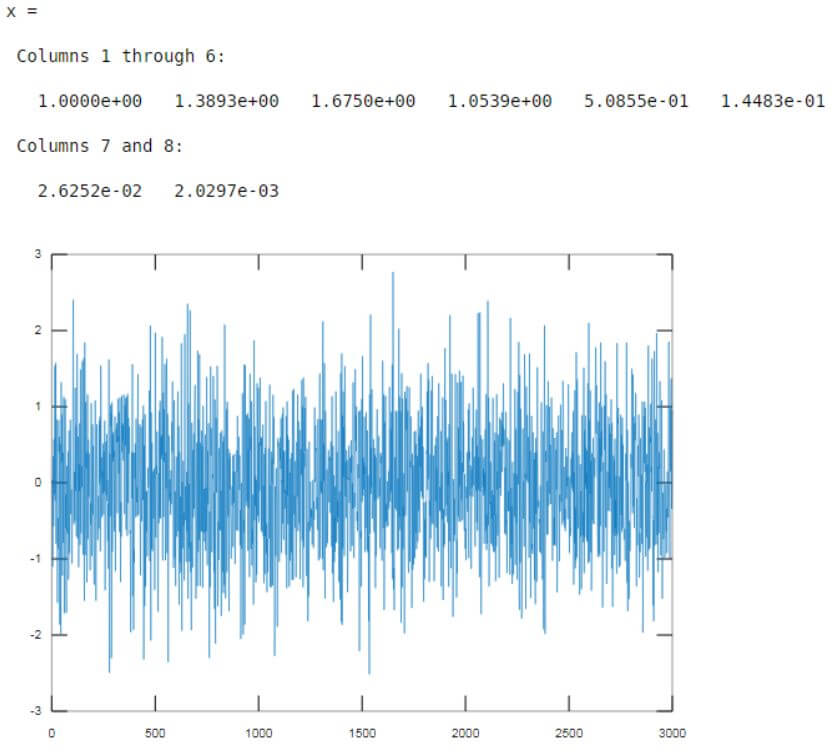
As we can see in the output, using a Low pass butterworth filter we are able to filter the signal of 3000 random samples.
In the above two examples, we have created low pass butterworth filters. Next, we will see how to create high pass butterworth filters.
Example #3
In this example, we will create a High pass butterworth filter:
For this example, we will follow the following 4 steps:
- Initialize the cut off frequency.
- Initialize the sampling frequency.
- For this example, we will create the high pass butterworth filter of order 9.
- Next, we will use the filter created in above steps to filter a random signal of 3000 samples.
Code:
F = 300
[Initializing the cut off frequency to 300]Fs = 1000
[Initializing the sampling frequency to 1000] [z, y, x] = butter(9, F/Fs, ‘high’) [Creating the butterworth filter of order 9. Please note that we have passed another argument ‘high’, which is used to create a high pass butterworth filter]inputSignal = randn(3000, 1);
[Creating a random signal of 3000 samples]outSignal = filter(z, x, inputSignal);
[Passing the input signal as an input to the butterworth filter created]plot(outSignal)
[Plotting the output of the butterworth filter]Input:
F = 300

Fs = 1000

[z, y, x] = butter(9, F/Fs, 'high')

inputSignal = randn(3000, 1);

outSignal = filter(z, x, inputSignal);

plot(outSignal)
Output:
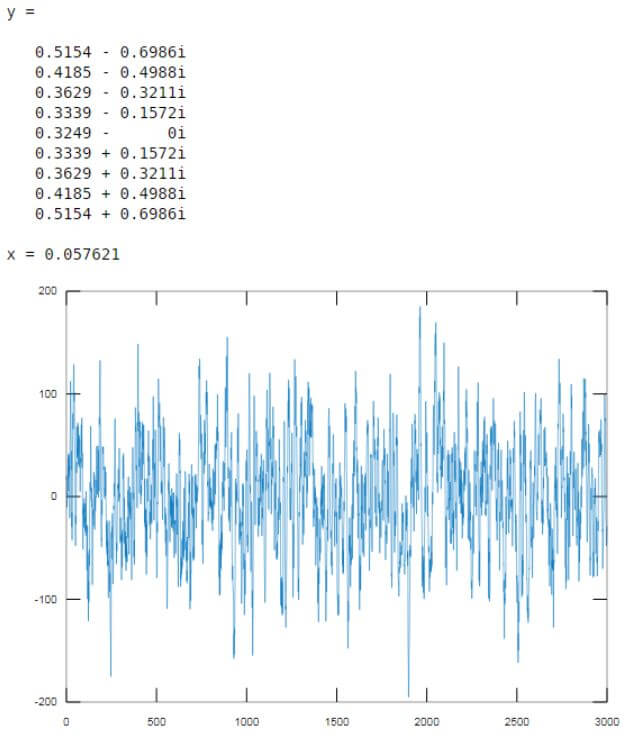
As we can see in the output, using a high pass butterworth filter we are able to filter the signal of 3000 random samples.
Conclusion
Butterworth filters are used to get maximally flat output within the defined passband. In Matlab, we use ‘butter’ command to design a Butterworth filter. Depending upon the argument passed, we can create various filter types like low pass, high pass etc.
Recommended Articles
This is a guide to Butterworth filter Matlab. Here we discuss the introduction to Butterworth filter Matlab along with examples respectively. You may also have a look at the following articles to learn more –
