Updated March 4, 2023

Introduction to Matlab Scripts
Matlab Script is a sequence of various commands, which are most likely used to represent some program and are executed in the same way as a program or single command in Matlab command window. The script is created using ‘edit’ command in Matlab. Variables that are created in a script can be accessed from the Matlab command window until we clear them or terminate the session. To run our script, we must save it in current directory, or in a directory saved on Matlab path. Matlab scripts must be saved as ‘.m’ extension and this is the reason they are referred as “M-files”.
Examples of Matlab Scripts
Given below are the examples:
Example #1
In this example we will create a script that will generate 5000 random numbers between 0 and 100. We will also create a histogram for all these numbers.
Below are the steps that we will follow for this example:
- Use ‘edit’ command to create new script.
- Write the code for generating 5000 random numbers and drawing a histogram.
Code:
edit myHisto
[Using the ‘edit’ command to create the script ‘myHisto’]Col= 5000;
[Initializing the number of columns]Row = 1;
[Initializing the number of rows]Bins = Col/100;
[Defining the Bins for the histogram]rng(now);
[Using the ‘Random number generator’ to create random values]A = 100*rand(Row, Col);
histogram(A, Bins)
[Drawing the histogram using above values] [Save this file as .m extension. Please keep in mind that the name of the file must be same as the name of the script, which is ‘myHisto’ in our example]Next, we need to call this script. This is done by typing the name of the script in the command window as below:
myHisto
[Calling the script created in the command window]Input:
edit myHisto

Col= 5000;

Row = 1;

Bins = Col/100;

rng(now);

A = 100*rand(Row, Col);

histogram(A, Bins)
Output:
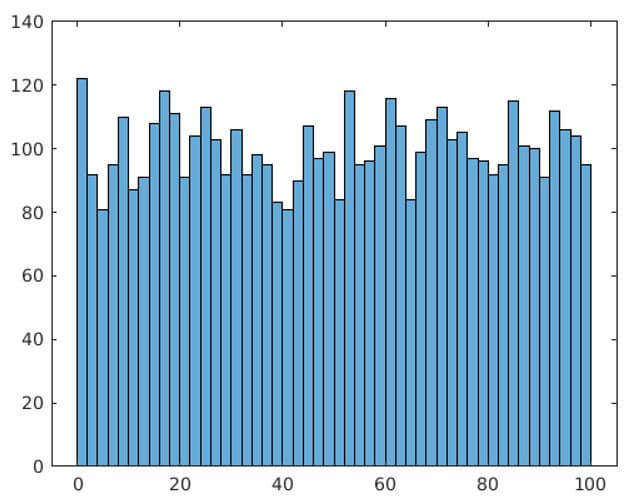
As we can see in the output, we have obtained a histogram of random values as expected by us.
Example #2
In this example we will create a script that will be used to find the integration of a function.
Below are the steps that we will follow for this example:
- Use ‘edit’ command to create the new script.
- Write the code for computing the integration using ‘integral’ function.
Code:
edit myIntegral
[Using the ‘edit’ command to create the script ‘myIntegral’]syms x
[Initializing the local variable ‘x’]Fx = @(x) 5*x.^3
[Creating the polynomial function of degree 3]A = integral (Fx, 0, 3)
[Passing the input function& the required limits] [Save this file as .m extension and keep the name as ‘myIntegral’] [Mathematically, the integral of 5*x ^3, between the limits 0 to 3 is 101.25]Next, we need to call this script. This is done by typing the name of the script in the command window as below:
myIntegral
[Calling the script created in the command window]Input:
edit myIntegral

syms x

Fx = @(x) 5*x.^3

A = integral (Fx, 0, 3)
Output:
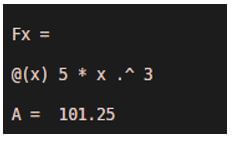
As we can see in the output, we have obtained integration of our function by calling the script.
Example #3
In this example we will create a script that will be used to draw a sphere.
Below are the steps that we will follow for this example:
- Use ‘edit’ command to create the new script.
- Write the code for drawing a sphere of radius ‘Rad’.
Code:
edit drawSphere
[Using the ‘edit’ command to create the script ‘drawSphere’] [a, b, c] = sphere; [Creating unit sphere]Rad = 2;
[Initializing the radius]surf(a * Rad, b * Rad, c * Rad)
[Adjusting the dimensions & creating the plot]axis equal
[Making the scale common for each axis] [Save this file as .m extension and keep the name as ‘drawSphere’]Next, we will call this script. This is done by typing the name of the script in the command window as below:
drawSphere
[Calling the script created in the command window]Input:
edit drawSphere

[a, b, c] = sphere;

Rad = 2;

surf(a * Rad, b * Rad, c * Rad)

axis equal
Output:
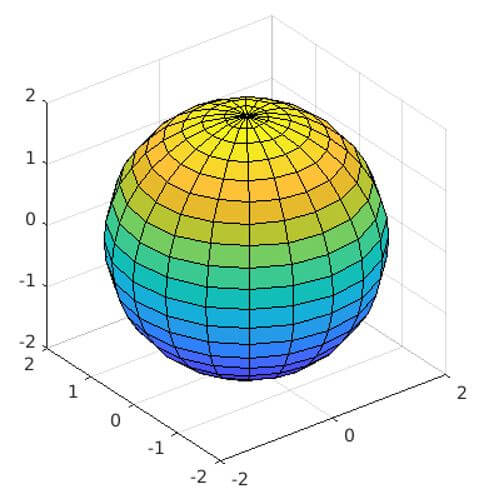
As we can see in the output, we have obtained a sphere by calling the script.
Example #4
In this example will plot a sine wave and a cos wave in the same plot using script.
Below are the steps that we will follow for this example:
- Use ‘edit’ command to create the new script.
- Write the code for creating the waves and plot them.
Code:
edit drawWaves
[Using the ‘edit’ command to create the script ‘drawWaves’]A = linspace (-pi, 2*pi);
[Initializing the interval]Y = sin(A);
[Creating the sine wave]Z = cos(A);
[Creating the cos wave]T = plot(A, Y, A, Z);
[Creating the plot] [Save this file as .m extension and keep the name as ‘drawWaves’]Next, we will call this script. This is done by typing the name of the script in the command window as below:
drawWaves
[Calling the script created in the command window]Input:
edit drawWaves

A = linspace (-pi, 2*pi);

Y = sin(A);

Z = cos(A);

T = plot(A, Y, A, Z);
Output:
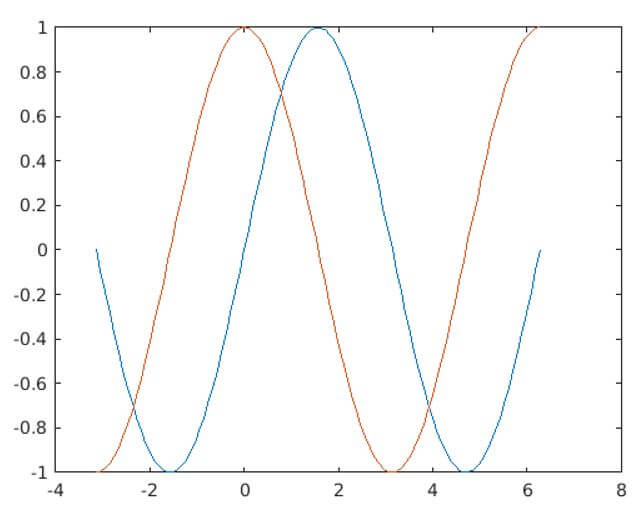
As we can see in the output, we have obtained a plot containing sine and cos waves by calling the script.
Conclusion
Scripts in Matlab consist of a sequence of commands which we use as a program by calling them from a separate command window. While creating a script, we must save it as .m extension and keep the file name the same as the name of the script.
Recommended Articles
This is a guide to Matlab Scripts. Here we discuss the introduction to Matlab Scripts along with the examples for better understanding. You may also have a look at the following articles to learn more –
