Updated March 4, 2023

Introduction to Matlab Findpeaks
A function is used to find peaks of the input data or signal is known as Matlab findpeaks. In Matlab, the findpeaks statement gives provision to find the peaks as well as its different parameters like location, width, etc. The Findpeaks statement can also use to display the peaks without output argument or data. The findpeaks function finds positive peaks as well as negative peaks. The Function returns the lowest index point if the peak is flat. The findpeaks function used “pks = findpeaks (data)” syntax for finding local peaks of the input signal vector or data.
Syntax
- pks = findpeaks(data)
- [pks,locs] = findpeaks(data)
- [___] = findpeaks(data,x)
- [___] = findpeaks(data,Fs)
- findpeaks ( data )
How to Do Matlab Findpeaks?
For getting peaks using Matlab findpeaks we follow the following steps:-
Step 1: Take an input signal or data
Step 2: Then we plot the signal or data by using plot function
Step 3: Then we use findpeaks statement with appropriated syntax
Step 4: Then we plot the figure which contains local maxima of the input signal
Examples of Matlab Findpeaks
Here are the following examples mention below
Example #1
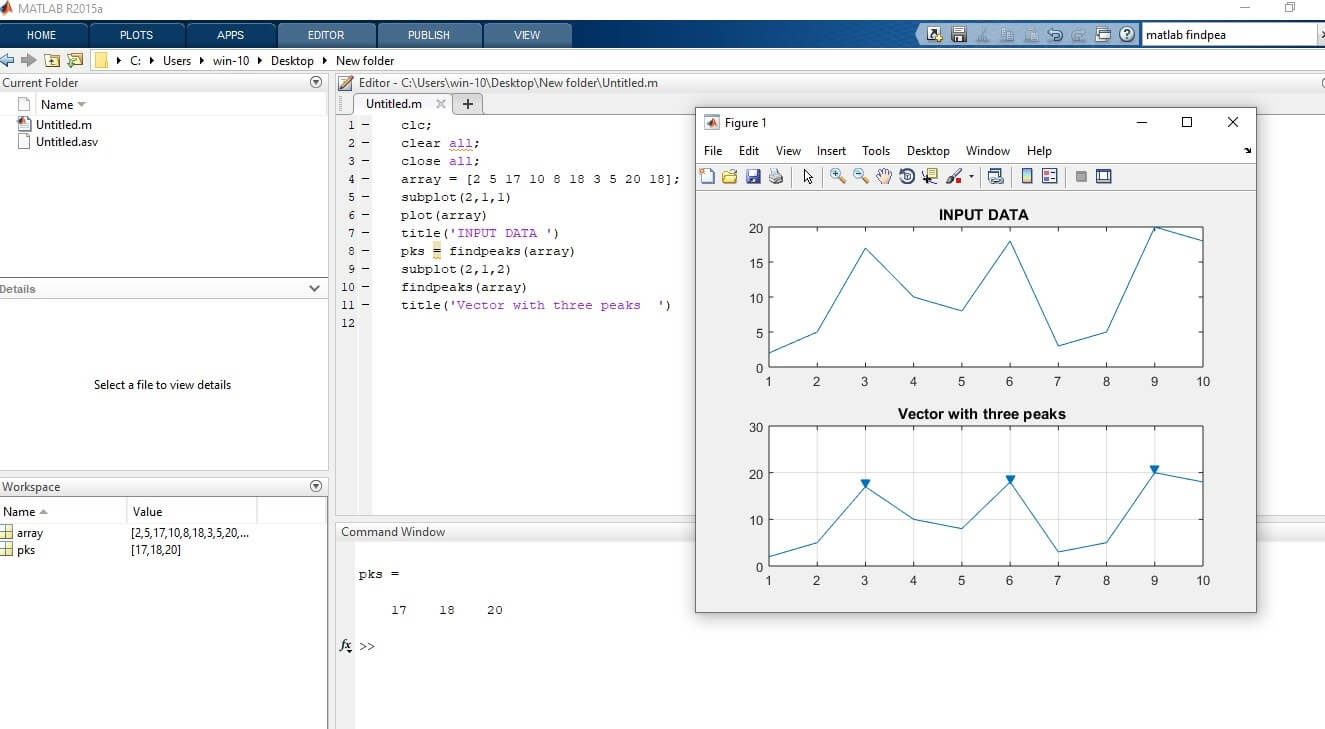
Let us see examples of MATLAB findpeaks. In the first example, we can find the maximum peaks of the input argument or data. In this example, we have a set of input data into the array. array = [2 5 17 10 8 18 3 5 20 18] this is set of data. First, we plot the input data using subplot and plot function. Then by using a findpeaks statement we can find the maximum peaks of the input data. After finding the maximum peaks plot the peaks.
Code:
clc;

clear all;

close all;

array = [2 5 17 10 8 18 3 5 20 18];

subplot(2,1,1)

plot(array)

title( 'INPUT DATA')

pks = findpeaks(array)

subplot(2,1,2)

findpeaks(array)

title( 'Vector with three peaks')
Output:
Example #2
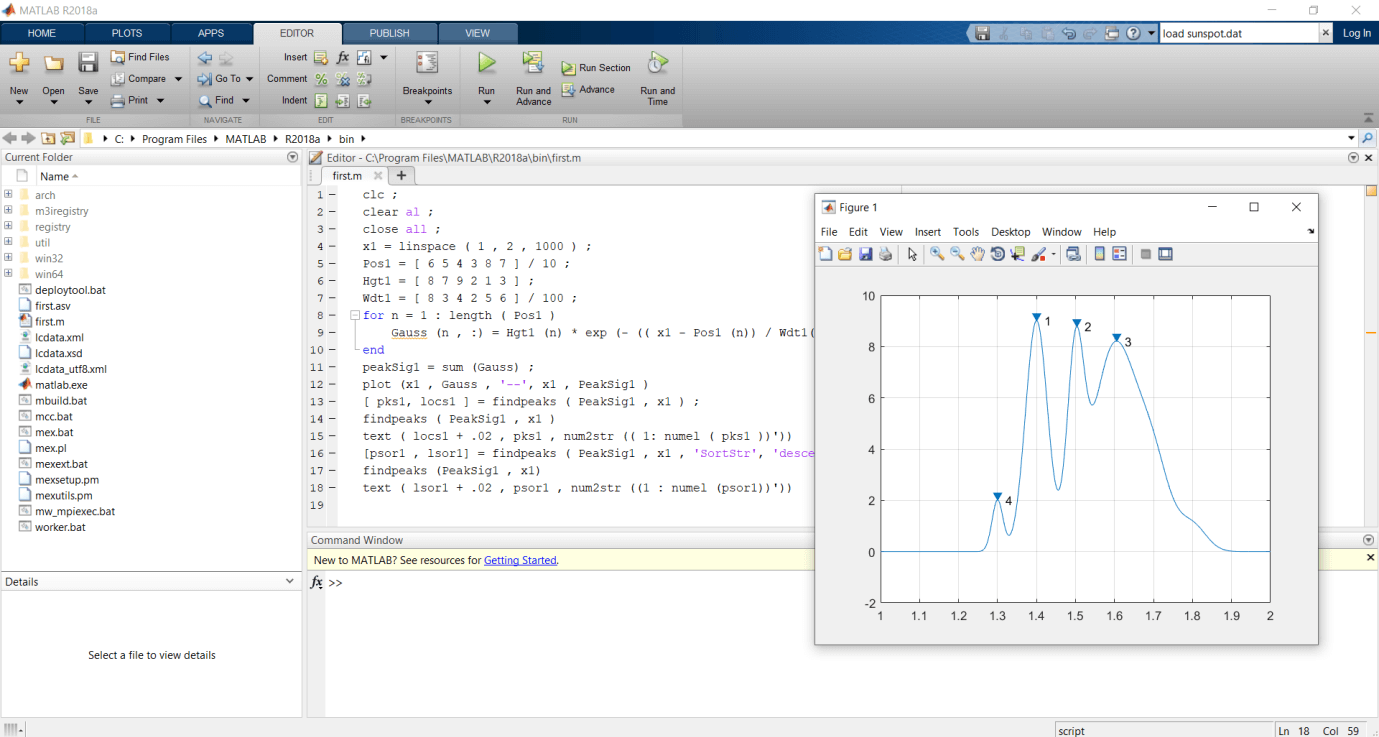
Let us see an example for find peaks and their location using a findpeaks function, for these first we create a linearly spaced vector using a “linspace” function we create a vector from interval 0 to 1 and this vector we take into x1 variable. We specify the position, width, and height of every curve and take these into in Pos1, Hgt1, and Wdt1. Then we plot individual curves and their sum. And now we apply the findpeaks with revert settings to discover peaks of the signal and their locations. Then plot the signal and label its peaks. And then we sort the peaks from the tallest to the shortest and label their peaks.
Code:
clc;

clear al;

close all;

x1 = linspace(1,2,1000);

Pos1 = [6 5 4 3 8 7]/10;

Hgt1 = [8 7 9 2 1 3];

Wdt1 = [8 3 4 2 5 6]/100;

for n = 1:length(Pos1)

Gauss(n,:) = Hgt1(n)*exp(-((x1 - Pos1(n))/Wdt1(n)).^2);

end

peakSig1 = sum(Gauss);

plot(x1,Gauss,'--',x1,PeakSig1)

[pks1,locs1] = findpeaks(PeakSig1,x1);

findpeaks(PeakSig1,x1)

text(locs1+.02,pks1,num2str((1:numel(pks1))'))

[psor1,lsor1] = findpeaks(PeakSig1,x1,'SortStr','descend');

findpeaks(PeakSig1,x1)

text(lsor1+.02,psor1,num2str((1:numel(psor1))'))
Output:
Example #3
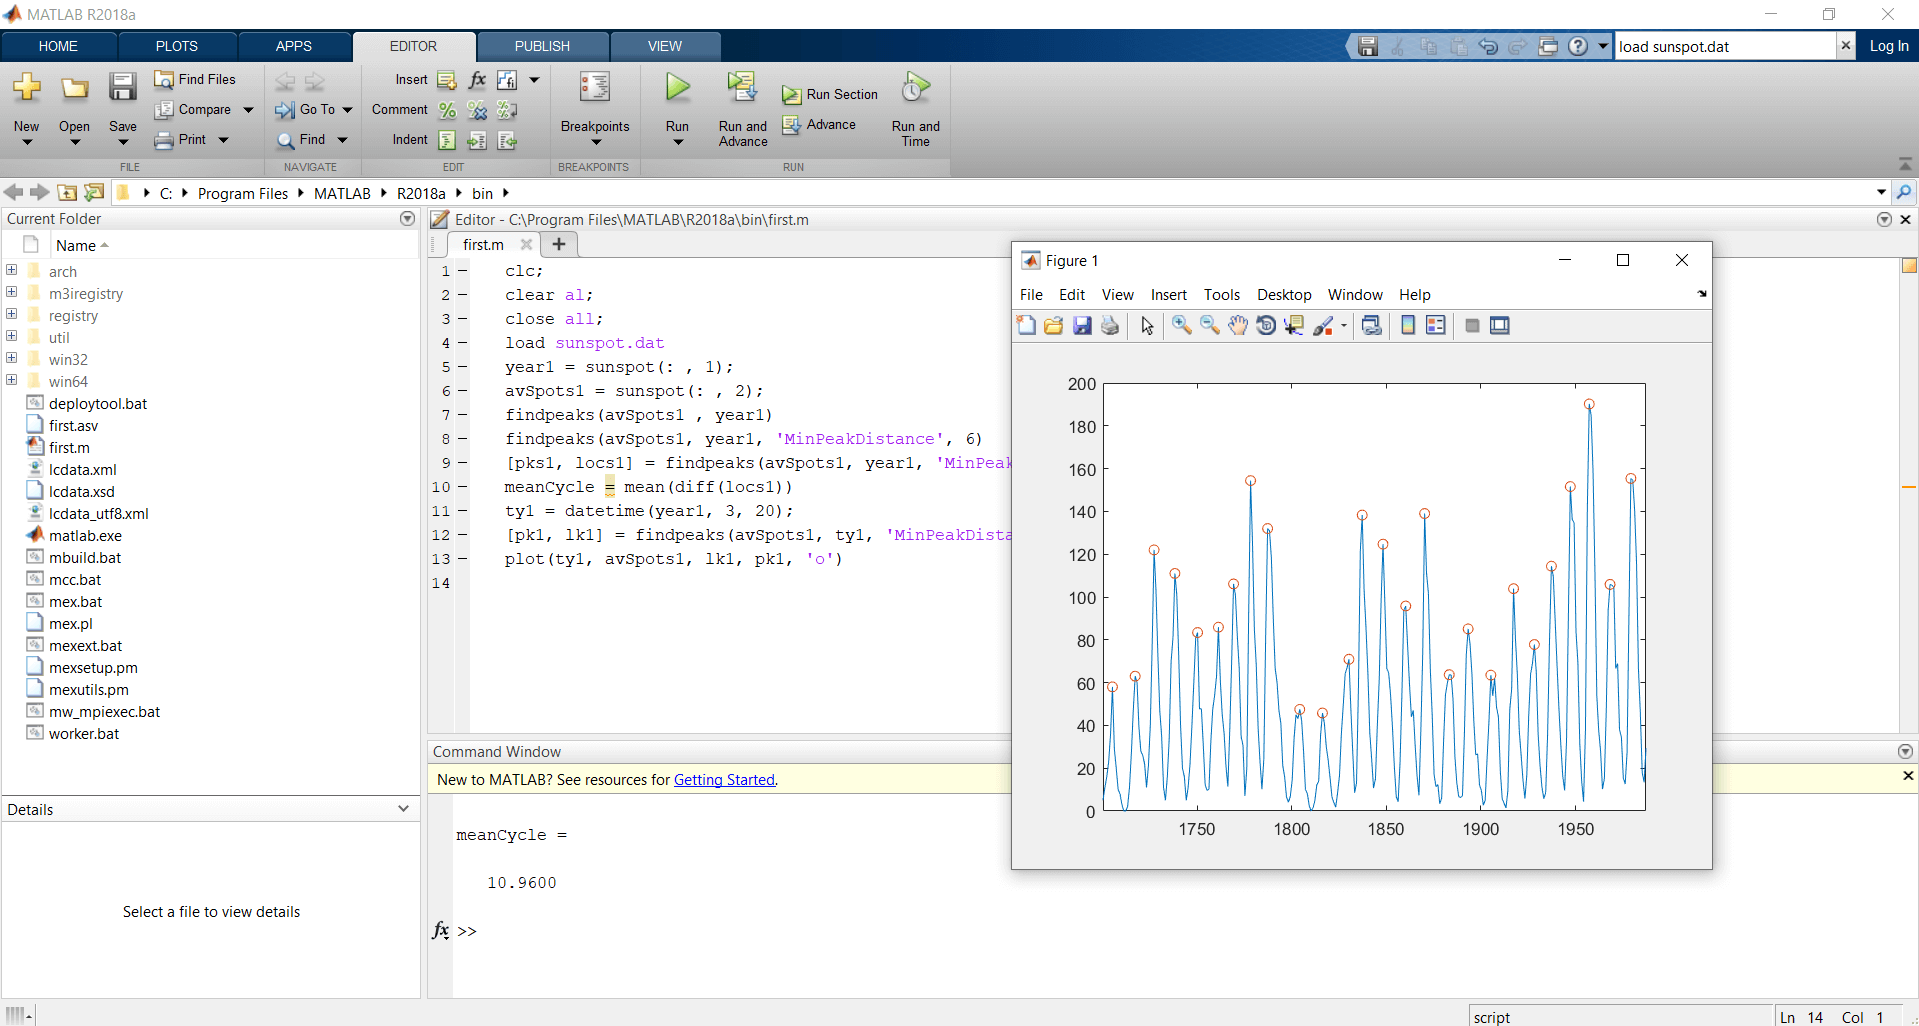
Let us see an example for findpeaks, first load the file sunspot.dat. The sunspots are a cyclic event. Basically, sunspot.dat contains the average number of sunspots observed every year from 1700 to 1987. Then we discover the maxima and plot it. Then now we upgrade you’re approximate of the cycle duration by ignoring peaks that are near to each other peaks. Again we found the peaks and plot it again. Now peaks greater than six years are restricted and all acceptable peaks are separated to values. The peak locations are used to find the peak statement to compute the midpoint between peaks. A date-time array is created by using the year data. Let’s assume the point where all sun rays pointed every year onMay 15th. Find the maxima of sunspot years using Matlab findpeaks statement.
Use the year’s function to identify the minimum peak separation of a sunspot.
Code:
clc;

clear al;

close all;

load sunspot.dat

year1 = sunspot(:,1);

avSpots1 = sunspot(:,2);

findpeaks(avSpots1,year1)

findpeaks(avSpots1,year1,'MinPeakDistance',6)

[pks1,locs1] = findpeaks(avSpots1,year1,'MinPeakDistance',6);

meanCycle = mean(diff(locs1))

ty1 = datetime(year1,3,20);

[pk1,lk1] = findpeaks(avSpots1,ty1,'MinPeakDistance',years(6));

plot(ty1,avSpots1,lk1,pk1,'o')
Output:
Conclusion
In this article, we saw the concept of Matlab Findpeaks. Basically Matlab Findpeaksis used to find the local peaks of the input signal or data. Then saw syntax related to Matlab Findpeaks and how it’s used in MatLab code. Also, we saw some examples related to Matlab Findpeaks statement.
Recommended Articles
This is a guide to Matlab Findpeaks. Here we discuss How to Do Matlab Findpeaks and Examples along with the codes and outputs. You may also have a look at the following articles to learn more –
