Updated March 20, 2023

Introduction to Arrays in R
Arrays in R is a feature that stores the similar types of data for processing. It accepts any number of elements to store. Arrays can be of one or multiple dimensions. The arrays created using vectors of one dimension is known as a one-dimensional array. Similarly Matrices used to store data in the R language are considered as a two-dimensional array. Array provides ease of access to the stored data element using the array index. Arrays in R languages are a preferred programming component while developing data processing for multiple data elements. R language supports Array function to construct the array and assign the data values.
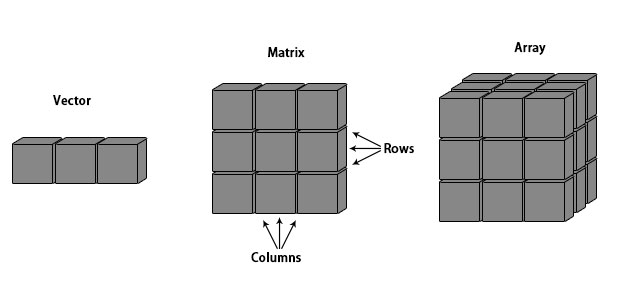
Pictorial representation: Vector, Matrix, Array
- One dimensional array referred to as a vector.
- Two-dimensional array referred to as a matrix.
Syntax:
Here is the syntax of array:
Array_NAME <- array(data, dim = (row_Size, column_Size, matrices, dimnames)
- data – Data is an input vector that is fed to the array.
- matrices – This refers to the dimensionality of matrices. Array in R can be multi-dimensional matrices.
- row_Size – row_Size depicts the number of rows that an array will comprise of.
- column_Size – column_Size depicts the number of columns that an array will comprise of.
- dimnames – This field if for changing the default names of rows and columns to the user’s wish/preference.
Properties:
- It’s homogeneous. That means it can store the same type of data.
- It stores data in contiguous memory
- Array elements can be accessed by knowing the index number.
How to Create an array in R?
Below are different scenarios on how to create an array in r as follows:
Scenario 1
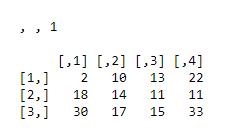
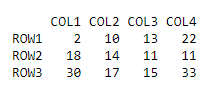
Let’s create an array that would be 3×4 matrices. Here 3 will row and 4 will be columns, matrices will be one. As our initial steps, let’s keep dimnames = NULL(which is a default value, if nothing specified ).
This is a one-dimensional matrix
R Code:
vector1 <- c(2,18,30)

vector2 <- c(10,14,17,13,11,15,22,11,33)

print(array(c(vector1, vector2),dim = c(3,4,1)))
Output:
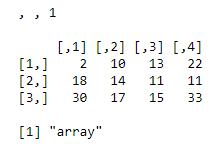
In order to check if finally created array got created or not.
Once array gets created:
Result
<- array(c(vector1, vector2),dim = c(3,4,1)))
The function “class” can help you with that.
class(Result)
R Code:
vector1 <- c(2,18,30)

vector2 <- c(10,14,17,13,11,15,22,11,33)

print(array(c(vector1, vector2),dim = c(3,4,1)))

Result <- array(c(vector1, vector2),dim = c(3,4,1))

class(Result)
Output:
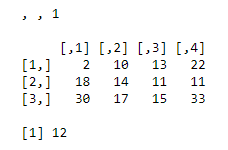
In order to check the dimension’s product of the array, one can use function: length.
R Code:
vector1 <- c(2,18,30)

vector2 <- c(10,14,17,13,11,15,22,11,33)

print(array(c(vector1, vector2),dim = c(3,4,1)))

Result <- array(c(vector1, vector2),dim = c(3,4,1))

length(Result)
Output:
Scenario 2
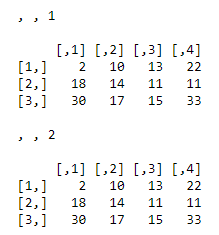
Let’s create the same array which would be 3×4 matrices. Here again, 3 will be a row and 4 will be columns, but matrices will be two. Let’s keep dimnames = NULL(which is a default value, if nothing specified ).
R code:
vector1 <- c(2,18,30)

vector2 <- c(10,14,17,13,11,15,22,11,33)

print(array(c(vector1,vector2),dim = c(3,4,2)))
Output:
Scenario 3
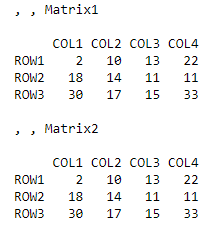
Let’s create the same array which would be 3×4 matrices. Here again, 3 will be row and 4 will be columns, but matrices will be two. Let’s see for values assigned to dimnames.
R code:
vector1 <- c(2,18,30)

vector2 <- c(10,14,17,13,11,15,22,11,33)

column.names <- c("COL1","COL2","COL3","COL4")

row.names <- c("ROW1","ROW2","ROW3")

matrix.names <- c("Matrix1","Matrix2")

array(c(vector1,vector2),dim = c(3,4,2),dimnames = list(row.names,column.names,

matrix.names ))
Output:
Now we are good at creating an array of any dimensionality. Let’s now focus on the way of accessing any element in an array.
How to Create an Access Elements array in R?
Below are different access elements on how to create an array in r as follows –
Scenario 1
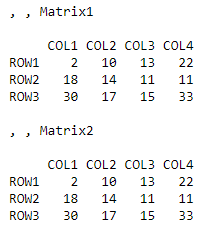
Let’s say we have the same array in R:
R Code:
vector1 <- c(2,18,30)

vector2 <- c(10,14,17,13,11,15,22,11,33)

column.names <- c("COL1","COL2","COL3","COL4")

row.names <- c("ROW1","ROW2","ROW3")

matrix.names <- c("Matrix1","Matrix2")

result <- array(c(vector1,vector2),dim = c(3,4,2),dimnames = list(row.names,column.names,

matrix.names))
Output:
Now, we need to access 3rd row,3rd column of the second matric in the array.
R Code:
vector1 <- c(2,18,30)

vector2 <- c(10,14,17,13,11,15,22,11,33)

column.names <- c("COL1","COL2","COL3","COL4")

row.names <- c("ROW1","ROW2","ROW3")

matrix.names <- c("Matrix1","Matrix2")

result <- array(c(vector1,vector2),dim = c(3,4,2),dimnames = list(row.names,column.names,

matrix.names))

result[3,3,2]
Output:
To summarize this, square brackets are used to denote an index. To specify the index in arrays, there are four choices available: positive integers, negative integers, logical values, element names
Scenario 2
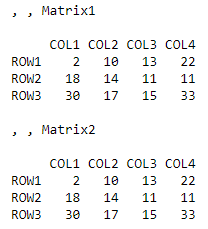
One needs to access an entire 1st array matrix:
R Code:
vector1 <- c(2,18,30)

vector2 <- c(10,14,17,13,11,15,22,11,33)

column.names <- c("COL1","COL2","COL3","COL4")

row.names <- c("ROW1","ROW2","ROW3")

matrix.names <- c("Matrix1","Matrix2")

result <- array(c(vector1,vector2),dim = c(3,4,2),dimnames = list(row.names,column.names,

matrix.names))

result[,,1]
Output:
Different Array Operation With Examples
This section will provide you grip over various operations carried out on arrays for achieving various results.
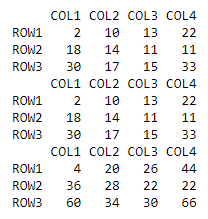
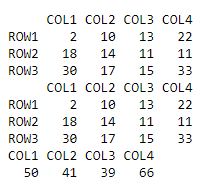
1. Addition & Subtraction
The multidimensional matrix has to be converted to the one-dimensional matrix, in order to be added or subtracted.
- Addition:
R code:
vector1 <- c(2,18,30)

vector2 <- c(10,14,17,13,11,15,22,11,33)

column.names <- c("COL1","COL2","COL3","COL4")

row.names <- c("ROW1","ROW2","ROW3")

matrix.names <- c("Matrix1","Matrix2")

result <- array(c(vector1,vector2),dim = c(3,4,2),dimnames = list(row.names,column.names,

matrix.names))

result[,,1]
result[,,2]
print(result[,,1] + result[,,2])
Output:
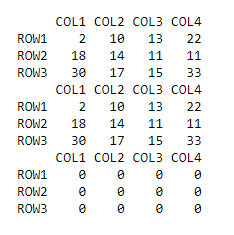
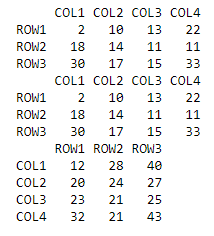
- Subtraction:
R code:
vector1 <- c(2,18,30)

vector2 <- c(10,14,17,13,11,15,22,11,33)

column.names <- c("COL1","COL2","COL3","COL4")

row.names <- c("ROW1","ROW2","ROW3")

matrix.names <- c("Matrix1","Matrix2")

result <- array(c(vector1,vector2),dim = c(3,4,2),dimnames = list(row.names,column.names,

matrix.names))

result[,,1]
result[,,2]
print(result[,,1] - result[,,2])
Output:
2. Calculations on Array element
A function name apply(), helps in applying any operation across array elements.
Syntax:
apply(x, margin, fun)
Here x is an array, the margin here refers to either rows or columns.
- MARGIN=1 for row-wise operation
- MARGIN=2 for column-wise operation
- MARGIN=c(1,2) for both.
Fun is the function applied across elements in the array of the data frame. These could be the standard functions that are part of R or custom functions (user-defined)
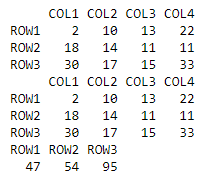
Example 1:
Row Wise R Code:
vector1 <- c(2,18,30)

vector2 <- c(10,14,17,13,11,15,22,11,33)

column.names <- c("COL1","COL2","COL3","COL4")

row.names <- c("ROW1","ROW2","ROW3")

matrix.names <- c("Matrix1","Matrix2")

result <- array(c(vector1,vector2),dim = c(3,4,2),dimnames = list(row.names,column.names,

matrix.names))

result[,,1]
result[,,2]
apply(result[,,1],1,sum)
Output:
Column Wise – R Code:
vector1 <- c(2,18,30)

vector2 <- c(10,14,17,13,11,15,22,11,33)

column.names <- c("COL1","COL2","COL3","COL4")

row.names <- c("ROW1","ROW2","ROW3")

matrix.names <- c("Matrix1","Matrix2")

result <- array(c(vector1,vector2),dim = c(3,4,2),dimnames = list(row.names,column.names,

matrix.names))

result[,,1]
result[,,2]
apply(result[,,1],2,sum)
Output:
This gives output in vector form which contains sum of individual columns. Here “sum” is the standard R function.
Example 2
R Code:
vector1 <- c(2,18,30)

vector2 <- c(10,14,17,13,11,15,22,11,33)

column.names <- c("COL1","COL2","COL3","COL4")

row.names <- c("ROW1","ROW2","ROW3")

matrix.names <- c("Matrix1","Matrix2")

result <- array(c(vector1,vector2),dim = c(3,4,2),dimnames = list(row.names,column.names,

matrix.names))

result[,,1]
result[,,2]
apply(result[,,1],1,function(x)  x+10)
Output:
This gives the output of the same dimension. The thing to notice here is, we have applied a user-defined function. This function is very useful and powerful while solving real-world problems. The function applied is also base for other complex functions like lapply(), rapply(), etc.
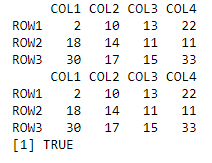
3. Check for Array
Check for array if the object is an array or not. The function name is.array() is a primitive function that lets you do so. Its gives output in terms True or False
R Code:
vector1 <- c(2,18,30)

vector2 <- c(10,14,17,13,11,15,22,11,33)

column.names <- c("COL1","COL2","COL3","COL4")

row.names <- c("ROW1","ROW2","ROW3")

matrix.names <- c("Matrix1","Matrix2")

result <- array(c(vector1,vector2),dim = c(3,4,2),dimnames = list(row.names,column.names,

matrix.names))

result[,,1]
result[,,2]
is.array(result)
Output:
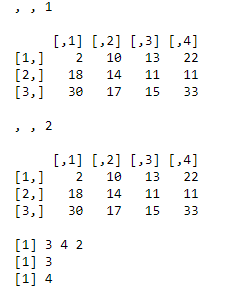
4. Check size of Array
Knowing dimensionality, a number of rows, columns of array helps in slicing and dicing of data. Here are some functions to do that: dim, nrow, ncol
R code:
vector1 <- c(2,18,30)

vector2 <- c(10,14,17,13,11,15,22,11,33)

result <- array(c(vector1,vector2),dim = c(3,4,2))

print(result)

dim(result)

nrow(result)

ncol(result)
Output:
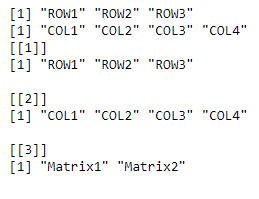
5. Check names of row and columns
In order to know the names of rows, columns and dimension names of an array. Below are the shown implementation of it.
R code:
vector1 <- c(2,18,30)

vector2 <- c(10,14,17,13,11,15,22,11,33)

column.names <- c("COL1","COL2","COL3","COL4")

row.names <- c("ROW1","ROW2","ROW3")

matrix.names <- c("Matrix1","Matrix2")

result <- array(c(vector1,vector2),dim = c(3,4,2),dimnames = list(row.names,column.names,

matrix.names))

rownames(result)

colnames(result)

dimnames(result)
Output:
Conclusion
Going through the above content would have given you a clear understanding of arrays in R. R is a statistical language, and arrays are frequently used data objects. This means, working with varieties of operations like add, subtract, apply, etc. with an array in any application will now be a cakewalk for you.
Recommended Articles
This has been a guide to Array in R. Here we discuss an introduction to Arrays in R, properties of R, how to create an array in R, and some sample examples. You can also go through our other suggested articles to learn more –
