


Updated October 28, 2026
What Is LLM Observability?
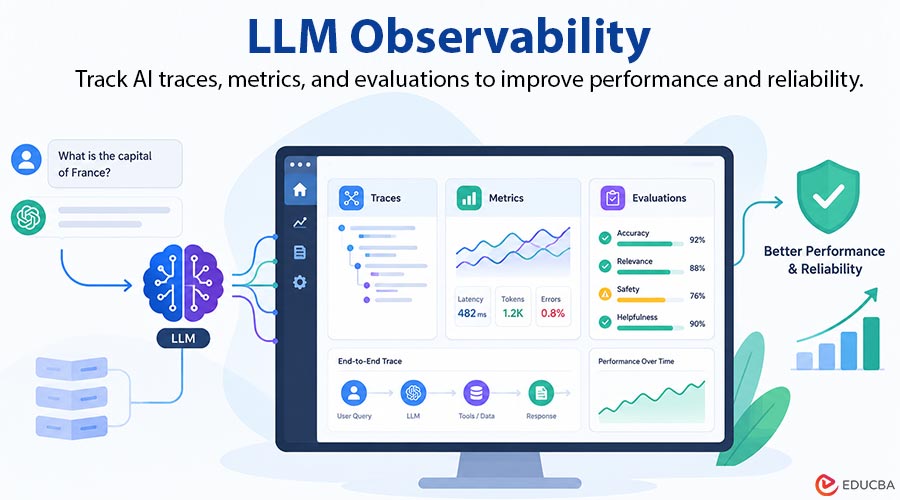
LLM observability is the practice of recording and checking what an AI app actually does in real use: its prompts, answers, steps, costs, and quality. That record lets you find and fix problems instead of guessing.
For example, a support chatbot tells a customer her refund will arrive in three days. The real policy says ten days. Nothing crashed, and no error appeared. Without a record of that answer, the team cannot say why.
Key Takeaways
- A trace shows what happened in one answer, step by step.
- Metrics show how the system behaves over time.
- Evaluations score whether answers are good, not just whether they arrived.
- Dashboards answer “what”. Traces answer “why”.
Why Normal Logs Are Not Enough?
Normal software either works or fails loudly. A page does not load, a button does nothing, or an error code appears. An AI app can fail quietly.
A model can return a polite, confident, wrong answer, and the server still reports success.
- Wrong facts: the answer invents a price, date, or policy that was never given to it.
- Wrong sources: the app retrieves the wrong document, then answers from it.
- Slow or costly answers: a loop of tool calls makes one question take far longer, or cost far more.
- Silent drift: answers get slightly worse after a prompt change, and nobody notices for weeks.
A plain log rarely saves the prompt version beside the answer. That missing link is the whole problem.
Traces: What Happened, Step by Step
A trace is the full record of one answer. Think of it as a receipt that lists every item, not just the total.
For an agent, one trace holds every step of a run. Each step is called a span: one timed record of a model call, a retrieval step, or a tool call. The spans sit inside one parent record for the whole run.
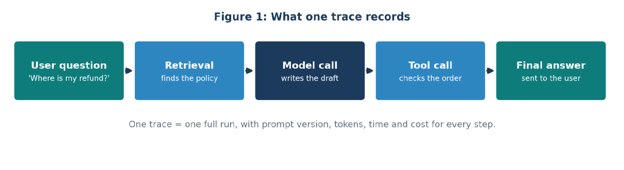
Figure 1: One trace, from the user question to the final answer.
| Inside one trace | What it tells you |
| User question | “Where is my refund?”, exactly as typed |
| Prompt version | Which instruction was live when the answer was made |
| Retrieved context | Which documents the model was given, and which it used |
| Model and tool calls | Each step, in order, with its own time and cost |
| Final answer | What the user actually received |
Reading a trace is a habit, not a skill. Open a recent answer and follow the steps. Soon you notice the same weak answer or slow step repeating.
Metrics: How the System Behaves Over Time
One trace explains one answer. Metrics explain thousands. They turn many traces into trends you can watch on a dashboard.
- Latency: Time per answer, and time to the first word for streaming replies.
- Tokens and cost: Tokens and cost per request, feature, or model.
- Error and retry rates: How often calls fail, time out, or need a second attempt.
- Tool success: How often each tool call works, and which tool fails most.
Watch averages with care. An average can look fine while one in ten answers is very slow. The slowest 5% of answers show the pain real users feel.
For effective LLM monitoring, begin with a small set of actionable metrics, such as response latency, error rate, and cost per request. Add more measurements as new performance or reliability questions arise.
Evaluations: Was the Answer Good?
Metrics tell you an answer arrived fast and cheaply. They do not tell you it was right. Evaluations do that job.
An evaluation scores an answer against a clear rule. “Good answer” is not a rule. “The answer uses only the ticket details given” is a rule, and you can score it.
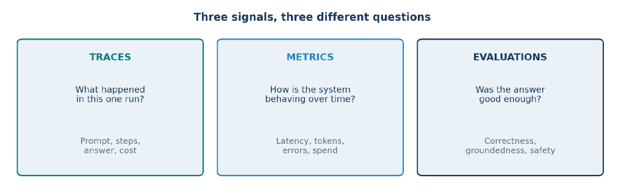
Figure 2: Traces, metrics, and evaluations answer three different questions.
| Evaluation type | What it checks | Best for |
| Rule check | Format, allowed words, or a value from the input | Fast, repeatable checks |
| Judge model | Correctness, groundedness, or safety, scored by a second model | Scoring many live answers |
| Human review | Judgment on tricky, sensitive, or borderline answers | The cases that matter most |
Run evaluations in two places. Before launch, test a new prompt on example questions, including ones that failed before. After launch, score live answers, so drift shows up early.
Only promote a new prompt when it scores better overall and does not break cases that used to pass.
Privacy note: Mask personal details in traces, and keep them only as long as you need them.
LLM Monitoring and Observability: What Is the Difference?
People often say LLM monitoring and observability as if they were one thing. They are related, but they are not the same job.
LLM monitoring watches numbers you already chose, and alerts you when they move out of range. That is useful, and it is only half the story.
| Comparison | Monitoring | Observability |
| Question | Is a known number out of range? | Why did this answer go wrong? |
| Main tool | Dashboards and alerts | Traces, plus evaluations |
| When it helps | You already know what to watch | You need to ask a new question after the fact |
| Example | Error rate jumps to 8% | The trace shows retrieval returned the wrong policy |
In short: monitoring tells you something changed. Observability gives you the evidence to explain it, and the scores to prove the fix worked.
Tools Compared
No single tool fits every team. The differences that matter most are tracing depth, evaluation strength, self-hosting, and whether the tool sits beside your app or in the request path. A gateway is one way to sit in that path: it routes every call through one endpoint, which makes cost and usage easier to watch in one place.
| Platform | Best known for | Check before you choose |
| LangSmith | Tracing and experiments for LangChain and LangGraph apps | How easily you can test a prompt change |
| Langfuse | Open-source tracing, prompts, and evaluations | Self-hosting and data control |
| Arize Phoenix | OpenTelemetry-based tracing and drift checks | How evals link back to traces |
| AcruxCore | Gateway tracing, prompt versions, and a feedback-to-fix loop | Whether gateway spend controls matter to you |
For a hands-on view, not marketing claims, see these observability platforms tested on the same task, prompt, and model.
Start with a free tier or self-hosted trial, and run your own failed examples through it.
How to Implement LLM Observability in Four Steps
Teams do not need a complicated setup to begin improving LLM observability. A small, consistent workflow can provide useful insights into AI performance and answer quality.
Step 1: Turn tracing on. Find one real trace from today, by hand.
Step 2: Save your prompts as prompt versions. Mark one version live, so everyone knows what real users are getting.
Step 3: Keep a small test set. Include past failures and edge cases, and run every prompt change against it.
Step 4: Review a few traces a day. Ten minutes a day beats a monthly report.
Final Thoughts
LLM observability does not make a language model perfect. It makes mistakes visible, measurable, and easier to fix. Start with a trace you can inspect, a prompt you can version, a test dataset you trust, and a few metrics you regularly monitor. These basic practices can help teams identify the causes of incorrect responses, control operational costs, and improve the reliability of AI applications.
As AI systems become more complex, combining traces, metrics, and evaluations provides a stronger foundation for building applications that deliver consistent, useful, and trustworthy responses.
Frequently Asked Questions (FAQs)
Q1. How is this different from normal app monitoring?
Answer: Normal monitoring checks whether a request succeeded and how long it took. This adds an AI layer: which prompt was used, what the model received, what it answered, and whether that answer was good.
Q2. Do small apps need traces?
Answer: Small teams need them more. A large team can absorb a week of mystery answers. A small team, with one support inbox and a name to protect, often cannot.
Q3. What should I measure first?
Answer: Latency, cost per request, and error rate for operations, plus one quality score for answers. Add more metrics only when a question needs them.
Q4. How do I choose a tool?
Answer: Run the same task, including a failed example, on each shortlisted tool. Choose the one where you find the cause fastest.
Recommended Articles
We hope this guide to LLM observability helps you improve AI performance and reliability. Check out these recommended articles for more insights into AI and machine learning.