Updated February 28, 2023
Introduction to Types of Data in Statistics
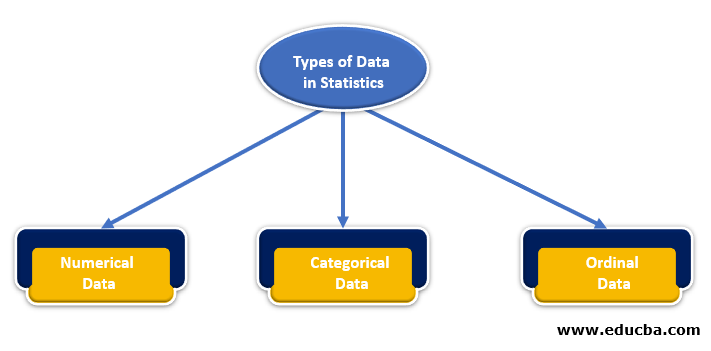
Statistics is the method that has a principle in the collection and organization of data, analyzing and interpreting the data, finally presenting the Types of Data in Statistics. When statistics are applied in the field of science or social issues, end to end process from statistical population to statistical design is analyzed in the form of surveys, forums, and experiments. The statistical method includes descriptive and inferential statistics which follows indexes, central tendencies, and probability theories. The statistical data is broadly divided into numerical data, categorical data, and original data.
Different Types of Data in Statistics
It should be important to identify the different types of data when working on statistics such as discrete or continuous. Because the data are significant functions which are essential to study a problem. The statistical data is broadly categorized into numerical which covers the discrete and continuous type of data, categorical data, and ordinal data.
1. Numerical Data
- The data includes a count or measurement of any object or person such as mass, volume, height, intelligent quotient, sugar level, number of shares, count of teeth, legs, pages in a book and so on. In simple, a finite count of numbers or values which can be analyzed from an object or person as an attribute accounted in the study of a certain domain is called numerical data. It is mostly represented in numbers and termed as quantitative data. It can be divided into continuous and discrete.
- The possible set of values that can be counted is termed as discrete data and it can be listed out. The array of discrete data sometimes is mixed includes finite or infinite counts. For instance, if the number of heads in flipping the coin 100 times gets the value from 0 to 100 which is finite, but the count of coin flips may take infinite times to reach 100 counts of the head. So this case is a mixture of finite and infinite scenarios.
- The possible set of values that cannot be counted and represented only at regular intervals on a number is termed as continuous data. For instance, the amount of gas procured at the pump of lorries with 200-gallon tanks can be represented as continuous data from 0 to 200 with the interval [0, 200] is comprehensive.
- But it is not possible to pump 80.4 gallons or 80.41234 gallons but it is possible to represent as a whole number ranges between 0 to 200. So in this way, it is considered as continuous data as it is infinite. To maintain and organize the data easily, statisticians prefer this method by round off in number lines.
- In scientific means, the lifetime of a battery varies from zero to infinite number as it lasts forever. It should be sorted with all possible values lies in between zero to a few hundred hours, as it is not possible to open a cap of the battery to check its draining capacity.
2. Categorical Data
- The characteristics or a behavioral attribute of a person or object is included under categorical data. It can be in any form such as gender, nativity, caste, marital status or a favorite thing.
- It can be represented in number such as if he likes a thing or object is denoted as 1 or if he doesn’t like that thing it is 2.
- So this type of data can be collected as a form of surveys or true or false questionnaire. It is not possible to club them together and this type of data is termed as qualitative data.
3. Ordinal Data
- It is accounted for as a mixture of numerical and categorical data. The data is arranged under categories and numbers are placed in the categories which give a correct meaning. For example, the hotel rating can be given from zero to five with the category from poor to excellent considering its ambiance, taste, service, cost, facilities, etc. By merging the data, the chart is prepared to analyze the performance of the hotel. The survey from a few people doesn’t give an optimal solution but the response of a hundred people gives a strong solution for research. From this, it is known that even numbers possess mathematical meaning. Since the number possess some additional value to the research, the original data represents a significant meaning of both numerical and categorical data.
- Numerical measurement is nominal and doesn’t give any reasonable ranking to a study whereas the ordinal values give inaccurate alterations in between the repeated values but insist to give meaning information from that sequence.
- The interval calibrations significant between the defined measurements but in some cases of temperature and geographical locations measurements, the zero possesses an arbitrary value which fails to give the correct information and enable only linear transformations. If the zero value and variations between measurement are predefined, the rescaling transformation is possible with ratio measurements.
- The variables that conform to ordinal and nominal measurement cannot be justified with numerical values. So it is grouped as categorical values and the intervals and ratio measurements are merged as quantitative values. In nature, it can be either discrete or continuous. In computer science, these values play an important role as Boolean functions in the computation and application integer, float in programming. But the mapping of both types of data in statistics and computer science is categorized according to the requirements and later extended in future researches.
- The relationship between any data and the hidden insights of their meaning silently reflect their functions and gives only the fact which is strictly prone to transformation. Since the statistical data is highly important for justifying any approach and plays a predominant role in decision making, Even though the mathematical terms such as notable grades, distinguished ranks, distinct fractions finite and infinite counts, quantities, continuous counts and ratios, periodic intervals, categorized and predefined data sounds similar, everyone has a very own defined meaning for their unique function in handling the high dimensional mathematical data.
Recommended Articles
This is a guide to Types of Data in Statistics. Here we discuss an introduction to Types of Data in Statistics with 3 different types. You can also go through our other related articles to learn more –

