Updated August 4, 2023
What is the t-Test Formula?
A t-test is a statistical tool that checks if there is any difference or correlation between two different sets of data. The t-test formula checks this by comparing the averages of both data sets.
Imagine you have two groups of plants, one group receives a new fertilizer, and another receives no fertilizer. Certainly, you expect there to be a difference in how fast the plants grow between the two groups. So, using the t-test formula, you compare the growth rates of the plants in each group. If the difference is big, it means the plants grew faster in one of the groups (it can be either of the groups). On the other hand, if the difference is not so big, it indicates that the plants grow at the same rate with or without fertilizer.
This article will teach different versions of this test and their respective formulas.
Table of Contents
Types of t-Test Formulas (With Excel Examples)
You can download this t-test Formula Excel Template here
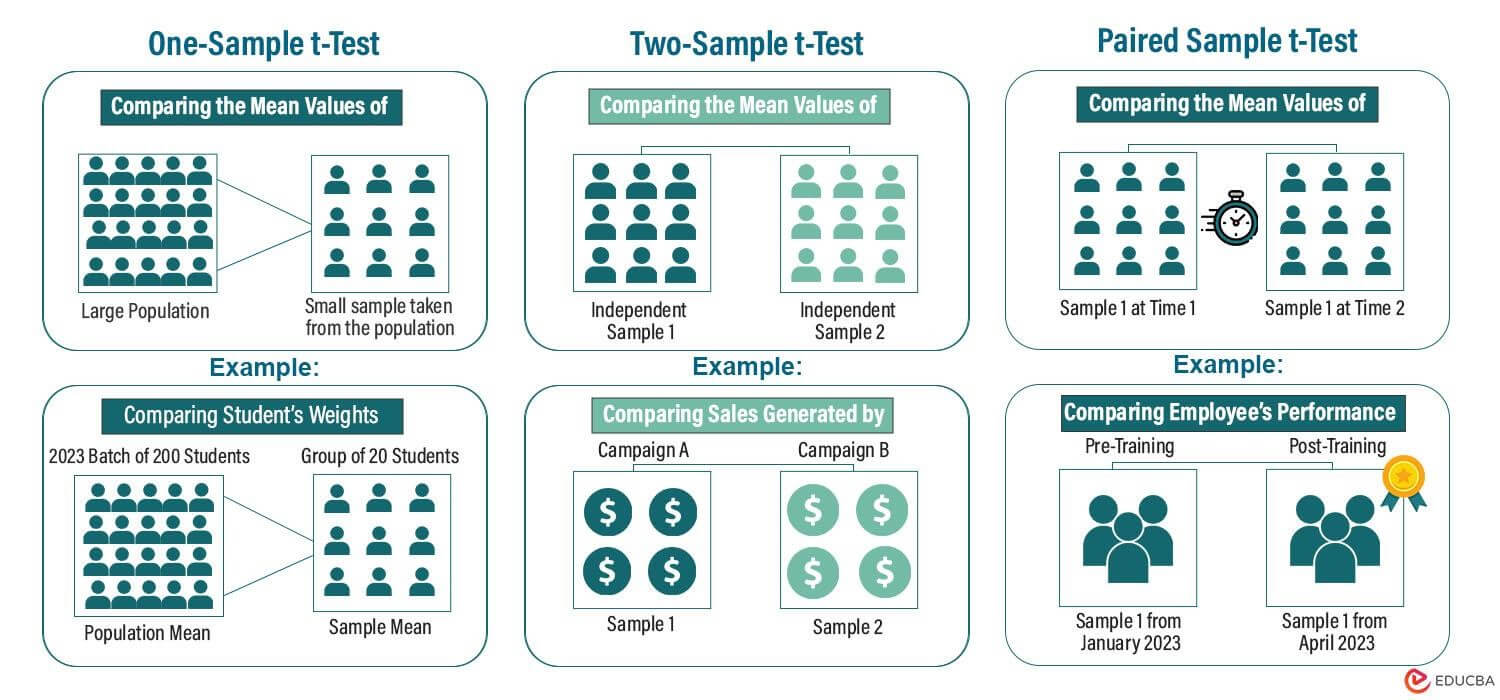
#1 One-Sample t-Test Formula
In a one-sample t-test, we take a small sample of data from a large population. For example, a small sample of 10 students from a large population of 150 students. The formula then takes the average of a small sample and compares it with the average of the population to check if there is any difference.
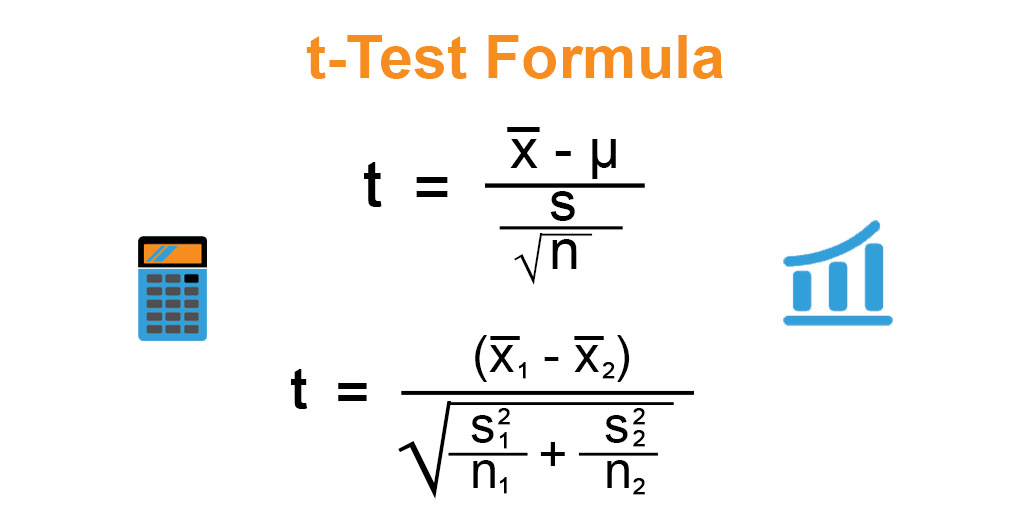
The simplest formula for a t-test is:

Here,
- x̄ = It is the observed mean, i.e., the sample’s mean value.
- μ = It is the theoretical or population mean, i.e., the population’s mean value.
- s = It is the standard deviation of the sample.
- n = It is the sample size, i.e., the number of observations in the sample.
Example:
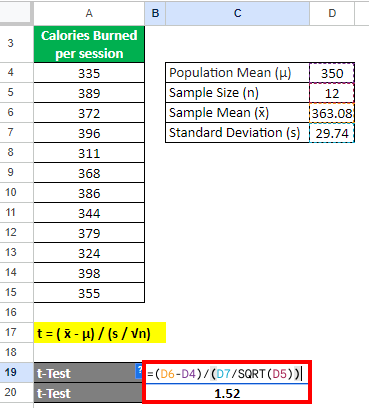
A fitness company launched a new app that provides workout sessions. They claim that their app can help users burn 350 calories on average per session. To test this, a researcher registers a sample of 12 participants on the app. They record the number of calories each participant burned in each workout session.
Let us calculate the one-sample t-test value using a 95% confidence interval to see if the claim about the average calorie burned per workout session using the app is true or not.
The hypotheses for this problem would be:
- Null Hypothesis – The app helps users burn 350 calories per session.
- Alternate Hypothesis – The app does not help users burn 350 calories per session.
Given,
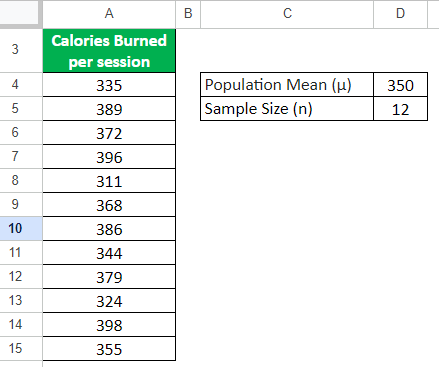
Solution:
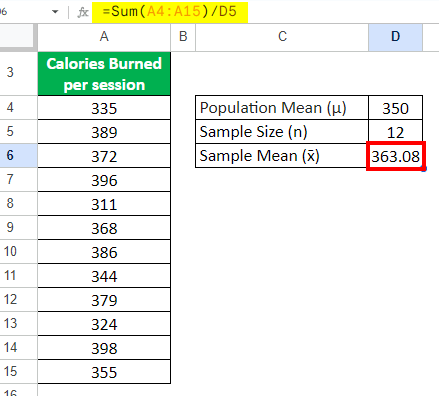
Step 1: Find the Sample Mean (Observed Mean)
Observed Mean = Sum of all values / Sample Size
=Sum(A4:A15)/D5 = 363.08
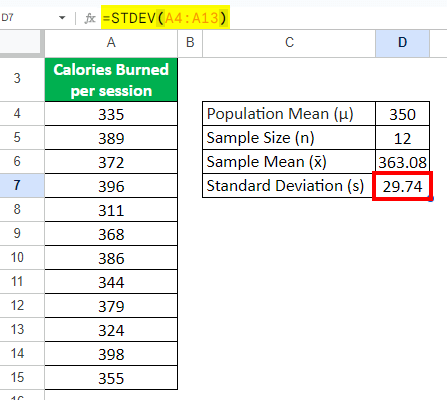
Step 2: Calculate the Standard Deviation
Use the formula below in the cell D7:
= STDEV (A4:A15)
= 29.74
Step 3: Find the t value
Let us find the t value using the formula below:
= (363.08 – 350) / (29.74 / √12)
= 1.52
The t-test value is 1.52.
Step 4: Calculate the degree of freedom & Critical Value
- The degree of freedom for one sample t-test is “n-1”, where n is the sample size. Thus, the degree of freedom here is 12-1 = 11.
- We can see that the critical value for the degree of freedom (11) in the T-distribution table at a 95% confidence interval is 201
Step 5: Interpret the t value
Finally, we need to check if the resulting t value is greater or smaller than the critical value.
- If T-test Value < Critical Value, we accept the null hypothesis.
- If T-test Value > Critical Value, we reject the null hypothesis.
Result:
| T-test Value | 1.52 |
| Critical Value (95% confidence level) | 2.201 |
| Our Analysis | T-test Value < Critical Value |
| Our Conclusion | Accept Null Hypothesis. It means that the app really helps users lose 350 calories per workout session. |
#2 Two-Sample t-Test Formula
In a two-sample t-test, we can compare the mean of two different groups. These two groups can either be related or different from each other. For example, we can use it to compare which sports are the most watched in the US.
The formula for the two-sample t-test is as follows:
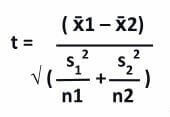
Here,
- x̄1 = Observed Mean of 1st Sample
- x̄2 = Observed Mean of 2nd Sample
- s1 = Standard Deviation of 1st Sample
- s2= Standard Deviation of 2nd Sample
- n1 = Size of 1st Sample
- n2 = Size of 2nd Sample
Example:
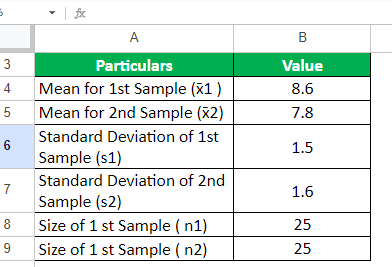
A restaurant owner wants to compare the average satisfaction ratings between two different restaurants that they own. They have collected survey responses from 25 guests who dined at the first restaurant, Easy Eats, and another 25 guests who dined at the second restaurant, Quick Bites.
Calculate a two-sample t-test with a 90% confidence interval to determine if there is a significant difference in satisfaction ratings between both restaurants.
Assume the null and alternate hypotheses as follows:
- Null Hypothesis – The average satisfaction ratings for both restaurants are the same.
- Alternate Hypothesis – There is a difference between the average satisfaction rating for the restaurant Easy Eats and Quick Bites.
Given,
Solution:
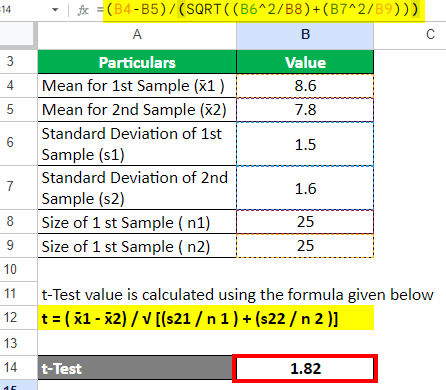
Step 1: Let us find the two-sample t-test value using the following formula:
=(B4–B5)/(SQRT((B6^2/B8)+(B7^2/B9))) = 1.82
Step 2: Calculate the degree of freedom for a two-sample t-test using the formula
= n1+n2-2
= 25 + 25 – 2 = 48.
Step 3: As per the distribution table, the critical value at a 90% confidence interval with a degree of freedom of 48 will be 1.677.
Result:
| T-test Value | 1.82 |
| Critical Value (90% confidence level) | 1.677 |
| Our Analysis | T-test Value > Critical Value |
| Our Conclusion | Accept Alternate Hypothesis It means there is a big difference between the satisfaction ratings of both restaurants. |
#3 Paired Sample t-Test Formula
In this method, we compare the average of a single group’s data at two different moments. This method is useful when we want to compare data for the same group before and after an experiment or test.
The formula for calculating the paired sample t-test is:

Here,
- m = Mean of a third data set. The third dataset is the difference between the posttest and pretest data.
- s = Standard deviation of the third data set.
- n = Number of observations of the third data set.
Example:
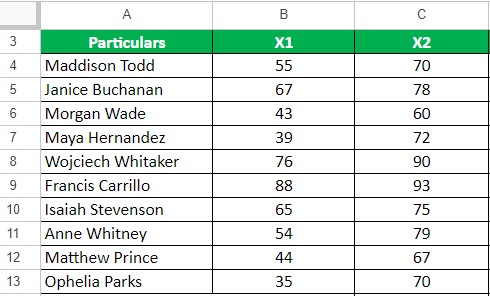
A company assessed the performance of 10 employees using a scale of 0 to 100. After providing a training program, the company re-evaluated the employees’ performance.
We need to perform a paired sample t-test for this data to check if we see a difference before and after the training. Consider the confidence interval as 95%.
Let us set the null and alternate hypotheses for this example:
- Null Hypothesis: The employees’ performance did not increase or decrease after training.
- Alternate Hypothesis: The performance of employees changed after the training program.
Given,
Solution:
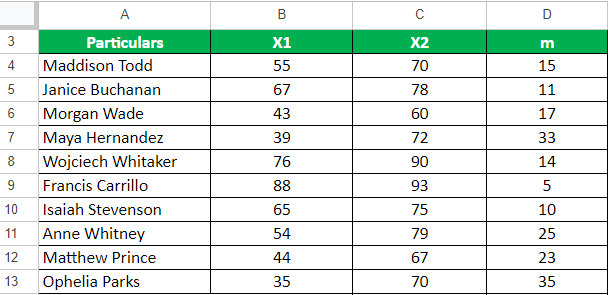
Step 1: First, calculate the difference between the data of both samples.
Here we will subtract the values of pre-training data from post-training data.
m = x2 – x1
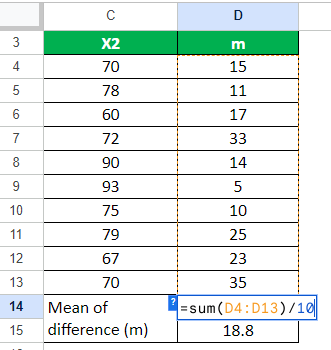
Step 2: We will now find the mean of the difference.
=sum(D4:D13)/10
= 18.8
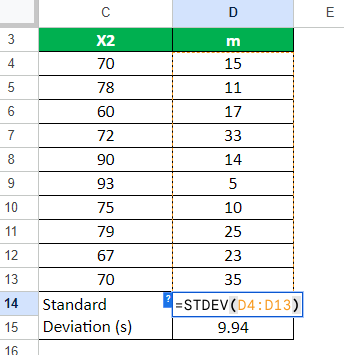
Step 3: Let us now calculate the standard deviation of the sample data.
We will use the Excel function “STDEV” to easily determine the standard deviation for the values:
Standard deviation (s) = STDEV(range of cells)
= STDEV(D4:D13)
= 9.94
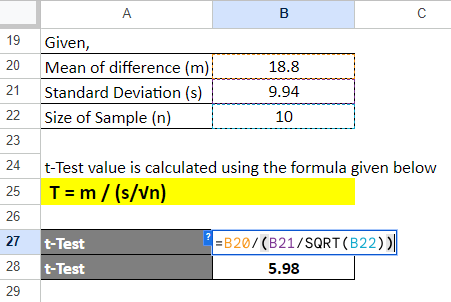
Step 4: After deriving all the values, we calculate the t-test value using the following formula.
t = m / (s / √n)
= 18.8 / (9.94 / √10)
= 5.94
Step 5: Calculate the degrees of freedom for this example using the formula “n-1”.
Therefore, it will be 10 – 1 = 9.
Step 6: Find the critical value at a confidence level of 95% for degrees of freedom 9, i.e., 2.262.
Result:
| T-test Value | 5.98 |
| Critical Value (95% confidence level) | 2.262 |
| Our Analysis | T-test Value > Critical Value |
| Our Conclusion | Accept Alternate Hypothesis It means that there is a significant difference in the employees’ performance after the training. |
Quick Reference Snapshot for all Types of t-Tests
t-Test Formula Calculator
You can use the following t-test Formula Calculator.
| x̄ | |
| μ | |
| s | |
| √n | |
| t-Test Formula | |
| t-Test Formula = | (x̄ - μ) / (s / √n) | |
| (0 - 0) / (0 / 0) = | 0 |
Assumptions of t-Test Formula
T-test does not suit every data type. If your data meets the following assumptions, you can use the t-test according to one, two, or paired sample type.
1. Normality
The majority of the data in the sample should be closer to the mean. There should only be a few values at the extremes (high or low). Basically, the data in each group should create a bell-shaped curve.
For example: If we want to compare the IQ scores of two groups, the majority of the IQ should fall in the average range. Only a few scores can be either extremely lower or higher than average.
2. Independence
The values of both data groups should be independent. A change in the values of one data group should not affect any change in the values of another group. The formula for the independent t-test is the two-sample t-test formula.
For example: If an employee works for two branches of the same clothing store, the sales data collected from each store cannot be considered independent because there is one employee who is common to both stores.
3. Random Sampling
The sample’s data must be random so that every data point has an equal chance of getting selected as the sample.
For example: If we want to check the intelligence of class A and class B students, we should not pick the toppers from both classes. This will be acceptable if we only want to compare toppers’ performance. But in random sampling from entire data, the selection of students must be random.
4. Homogeneity of Variance
All data groups should have the same units of measurement (kilometers or miles, etc.) or importance and an equal number of observations.
For example: If we want to compare the weight of two different types of fruits, we must pick two fruits that have almost similar weights, like apples and oranges. We cannot perform a t-test for fruits with significantly different weights, like a watermelon and an orange.
5. Consistent Metrics
The data should be measured on a numerical scale with consistent units of measurement.
For example: If we compare the weights of two groups, we should measure the weight in pounds or kilograms for all the objects to maintain a consistent unit of measurement.
Real-Life Application of t-Test
The following are some uses of the t-test in various real-world areas, such as:
- Medical Research: The t-test helps scientists compare treatments or medications to determine which works better.
- Business and Economics: The t-test helps businesses determine if their marketing strategies are effective or if changing prices will affect customer behavior.
- Education: The t-test helps teachers and researchers compare different teaching methods, new educational programs, or technologies to see which ones help students learn better.
- Quality Control: The t-test helps companies ensure their products meet certain quality standards by comparing the performance or durability of different batches or suppliers.
- Logistics: The t-test evaluates the effectiveness of supply chain improvements or changes by analyzing differences in delivery times.
z-Test vs. t-Test Formula
Both the tests are majorly similar other than a few differences, which we have mentioned in the table below:
| Basis | t-test | z-test |
| Sample Size | Smaller sample size (n<30) | Larger sample size (n>=30) |
| Data Distribution Used for Finding Critical Value | Student’s t distribution | Normal distribution |
| Degree of Freedom | Necessary for interpretation of the results | Not necessary |
| Need to find P-Value | P-Value is not necessary for the t-test | Calculate P-Value only if either condition is true.
|
| Assumptions | Requires a more extensive set of assumptions, which may not always be met. | More straightforward to compute and interpret due to fewer assumptions. |
Frequently Asked Questions (FAQs)
Q1. Who gave the concept of the t-test?
Answer: William Sealy Gosset, a statistician, and chemist at Guinness Brewery in Dublin, Ireland, created the t-test in the early 1900s. His goal was to assess the quality of Guinness beer and develop statistical techniques to examine how they could improve the quality.
Q2. What are the limitations of the t-test formula?
Answer:
- Normality Assumption: It assumes the data follows a certain shape, like a bell curve. Still, in real life, data can be more irregular.
- Small Sample Size: A small sample data does not represent the population properly. But when we have limited data in real-time, it is impossible to choose a larger sample.
- Independence: It assumes that each data point is unrelated to the others, but in reality, they can be influenced by each other.
- Outliers: They are values that are present at the extreme ends of the data set. They can affect the results, even if they are just a few. However, it is a common occurrence in the real world.
Q3. What is the difference between the t-test vs. ANOVA test?
Answer: The t-test and ANOVA test are different due to the following reasons:
- The t-test compares only two data groups, but ANOVA can compare three or more groups.
- T-test uses T-statistic, whereas ANOVA uses F-statistic.
- The t-test compares two data groups that relate to each other, but ANOVA concentrates on unrelated or independent variables.
- T-test is a basic calculation, whereas ANOVA needs further calculations.
Recommended Articles
This article acts as a guide to the various types of t-test formula. Here, we explain each type of t-test using practical examples and teach how to calculate the t-test value. You can also use the downloadable Excel template and the t-test calculator for better understanding. You may also look at the following articles to learn more –
