


Updated November 7, 2026
What is Simpson’s Paradox?
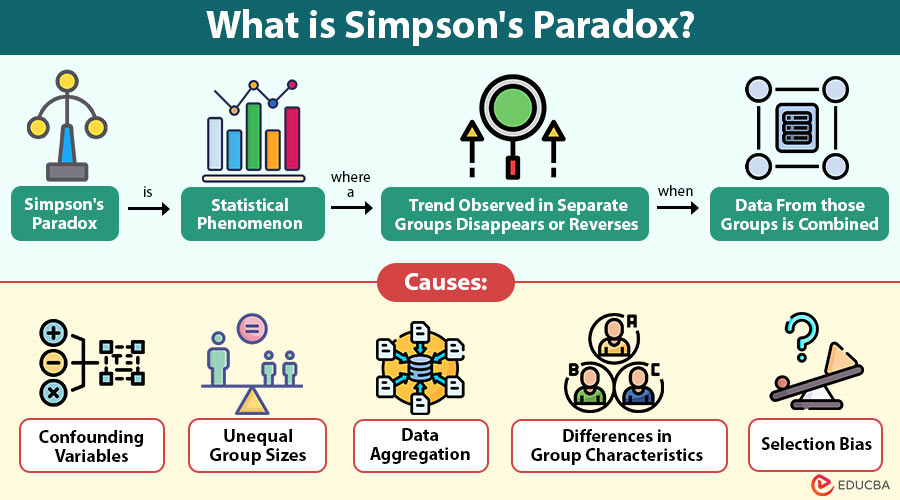
Simpson’s Paradox is statistical phenomenon where a trend observed in separate groups disappears or reverses when the data from those groups is combined.
Imagine two hospitals treating patients with the same medical condition. Hospital A has a higher recovery rate than Hospital B for both mild and severe cases. Based on these results, you might believe Hospital A performs better overall. However, when you combine all patient records, Hospital B suddenly shows a higher overall recovery rate.
How is that possible?
The answer lies in how patients are distributed between the hospitals. One hospital may treat more serious cases, while the other handles mostly mild cases. This situation is known as Simpson’s Paradox.
It shows that numbers can sometimes tell different stories depending on how information is grouped. Understanding this concept helps analysts avoid misleading conclusions and make better decisions.
Table of Contents:
- Meaning
- Importance
- Working
- Causes
- Examples
- How to Identify Simpson’s_paradox?
- Applications
- Difference
- How to Avoid Simpson’s Paradox?
- Benefits
- Limitations
Key Takeaways:
- Simpson’s Paradox occurs when relationships within separate data groups change or reverse after their results are combined.
- Differences in group sizes and underlying characteristics can create misleading patterns in aggregated statistical information.
- Examining relevant variables helps analysts understand why overall results sometimes contradict patterns observed within individual groups.
- Understanding Simpson’s Paradox supports more accurate data interpretation, better research practices, and informed business decisions.
Why is Simpson’s Paradox Important?
Businesses and researchers regularly use data to understand performance, identify patterns, and make decisions. However, looking only at overall results can sometimes create an incomplete picture.
For example, a company might compare sales performance across two regions. One region may appear more successful overall, even though the other performs better within every product category.
Without examining the underlying data, management could make an incorrect decision. Simpson’s Paradox is important because it encourages analysts to investigate the factors influencing statistical results. It also demonstrates why understanding the context behind numbers matters just as much as calculating them correctly.
How Does Simpson’s Paradox Work?
Simpson’s Paradox becomes easier to understand through a numerical example.
Consider two online stores, Store A and Store B, selling products to new and returning customers.
Their purchase conversion rates are shown below.
| Customer Type | Store A | Store B |
| New Customers | 9/10 = 90% | 80/100 = 80% |
| Returning Customers | 30/100 = 30% | 2/10 = 20% |
| Overall | 39/110 = 35.45% | 82/110 = 74.55% |
Notice something interesting. Store A performs better for both new customers and returning customers. However, Store B has a much higher overall conversion rate.
Why does this happen?
Store A receives most of its traffic from returning customers, who have lower conversion rates in this example. Meanwhile, Store B receives most of its traffic from new customers, who have higher conversion rates.
When the results are combined, these differences in customer distribution influence the overall percentages. Therefore, the combined results suggest a different conclusion from the individual customer groups. This is how Simpson’s Paradox works.
What Causes Simpson’s Paradox?
Several factors can contribute to Simpson’s Paradox.
1. Confounding Variables
A confounding variable is an additional factor associated with the variables being compared that can influence the observed relationship.
2. Unequal Group Sizes
Different numbers of observations across groups can strongly influence combined results, especially when the groups have different underlying success rates.
3. Data Aggregation
Combining information from multiple categories can hide important differences, causing overall statistical patterns to appear inconsistent with individual group results.
4. Differences in Group Characteristics
Groups may contain individuals with different characteristics, such as age, experience, income, or health conditions, which influence the outcomes being measured.
5. Selection Bias
When observations enter different groups through nonrandom processes, comparisons may reflect those selection differences rather than the relationship researchers intend to examine.
Real-World Examples of Simpson’s Paradox
Simpson’s Paradox can appear in different industries and everyday situations.
1. Healthcare
Two hospitals may report different recovery rates. Hospital A could achieve better recovery rates for both mild and severe cases, yet show a lower overall rate because it treats more severely ill patients. Comparing hospitals without considering illness severity could therefore produce misleading conclusions.
2. Education
Imagine two schools comparing examination results. School A performs better among both beginner and advanced students. However, School B has a higher overall passing percentage because it has a larger proportion of advanced students. The difference in student distribution changes the combined results.
3. Marketing
A business runs two advertising campaigns across mobile and desktop devices. Campaign A generates better conversion rates on both devices. However, Campaign B achieves a higher overall conversion rate because it receives more traffic from the device category with stronger conversions. Without examining device-level performance, marketers might select the less effective campaign for each device category.
4. Sports
Two cricket players have different batting averages across two seasons. Player A performs better in each season individually. However, Player B may have a higher combined batting average because the players faced different numbers of deliveries across those seasons. This illustrates how the weighting of individual performances can influence overall comparisons.
How to Identify Simpson’s Paradox?
Identifying Simpson’s Paradox requires examining data beyond overall averages.
1. Examine Individual Groups
Divide the dataset into meaningful categories and compare relationships within each group before drawing conclusions from combined results.
2. Compare Aggregated Results
Calculate overall statistics and check whether their direction differs from patterns observed within the individual groups.
3. Identify Relevant Variables
Look for additional factors that may influence outcomes, such as customer characteristics, product categories, or differences in treatment conditions.
4. Check Group Sizes
Examine how observations are distributed across categories because unequal group sizes can significantly influence overall averages and percentages.
5. Use Data Visualization
Create charts or graphs to compare grouped and combined results, making unexpected differences easier to recognize and investigate.
Applications of Simpson’s Paradox
Understanding Simpson’s Paradox is useful across several professional fields.
1. Data Analytics
Data analysts examine grouped information to identify misleading trends and understand the factors influencing overall business performance.
2. Business Intelligence
Organizations use segmented reporting to compare performance across products, customer categories, regions, and other important business dimensions.
3. Medical Research
Researchers consider patient characteristics and treatment conditions when comparing outcomes, helping them interpret statistical findings more accurately.
4. Financial Analysis
Financial analysts examine investment performance across different market conditions, time periods, and asset categories before evaluating combined returns.
5. Digital Marketing
Marketing teams compare campaign results across customer segments, advertising platforms, and devices to understand differences in conversion performance.
Difference Between Simpson’s Paradox and Ecological Fallacy
The table below highlights the differences between the two:
| Basis | Simpson’s Paradox | Ecological Fallacy |
| Meaning | A statistical trend changes or reverses after groups are combined. | Group-level patterns are incorrectly applied to individuals. |
| Main Issue | Differences between grouped and aggregated results. | Incorrect assumptions about individual characteristics. |
| Example | Overall hospital recovery rates contradict subgroup comparisons. | Assuming every resident of a wealthy area has a high income. |
| Focus | Relationships across different levels of aggregation. | Incorrect individual conclusions from group statistics. |
| Prevention | Examine relevant subgroups and underlying variables. | Avoid inferring individual behavior from aggregate information alone. |
How to Avoid Simpson’s Paradox?
Simpson’s Paradox is not a mathematical error. It is a genuine statistical phenomenon that requires careful interpretation.
The following practices can help prevent misleading conclusions.
1. Analyze Segmented Data
Review results across relevant categories instead of relying entirely on combined averages, which may hide important differences between groups.
2. Understand the Data Context
Investigate how information was collected, which populations were included, and what factors could influence the observed outcomes.
3. Consider Confounding Factors
Identify variables associated with both group membership and outcomes, and evaluate whether adjusting for them changes the interpretation.
4. Apply Suitable Statistical Methods
Use appropriate techniques, such as stratified analysis or regression, when the research question requires accounting for additional variables.
5. Interpret Results Carefully
Avoid assuming that either grouped or combined results are automatically correct; the appropriate interpretation depends on the question being investigated.
Benefits of Understanding Simpson’s Paradox
Understanding this statistical concept offers several advantages.
1. Better Decision-Making
Recognizing misleading overall trends helps businesses evaluate performance more carefully before making important operational or strategic decisions.
2. Improved Data Accuracy
Examining relevant categories helps analysts develop a more complete understanding of statistical relationships and the factors influencing reported outcomes.
3. Stronger Analytical Thinking
Questioning unexpected results encourages professionals to investigate underlying assumptions, compare alternative explanations, and avoid conclusions based solely on averages.
4. More Reliable Research
Researchers can improve their interpretation of findings by considering group differences, possible confounding factors, and appropriate statistical comparisons.
5. Effective Performance Evaluation
Organizations can compare departments, products, campaigns, or services more fairly by accounting for meaningful differences between the groups being evaluated.
Limitations of Simpson’s Paradox
Although Simpson’s Paradox provides valuable insights, understanding it also involves certain challenges.
1. Difficulty Identifying Hidden Factors
Important variables may not always be available in the dataset, making it difficult to explain why statistical relationships change.
2. Complex Data Analysis
Examining multiple groups and their relationships may require additional calculations, statistical knowledge, and careful interpretation of results.
3. Risk of Incorrect Segmentation
Dividing data into inappropriate categories can create confusion or introduce misleading patterns instead of improving understanding.
4. Limited Causal Explanation
Simpson’s Paradox highlights differences between statistical relationships but does not independently establish which variables cause the observed outcomes.
5. Dependence on Data Quality
Missing records, inaccurate measurements, and inconsistent data collection methods can make identifying and interpreting statistical patterns more difficult.
Final Thoughts
Simpson’s Paradox shows how statistical relationships can change when data from different groups is combined. It highlights the importance of examining underlying factors, group differences, and data distribution. Understanding this phenomenon helps businesses, researchers, and analysts interpret findings accurately and make better-informed decisions.
Frequently Asked Questions (FAQs)
Q1. Is Simpson’s Paradox a mathematical mistake?
Answer: No. It occurs because combining groups changes how observations contribute to overall statistical results.
Q2. Does Simpson’s Paradox always involve percentages?
Answer: No. It can involve averages, proportions, correlations, and other statistical relationships that change when data is aggregated.
Q3. Does Simpson’s Paradox prove that statistics are unreliable?
Answer: No. It demonstrates that statistical results require proper context and careful interpretation rather than relying exclusively on overall figures.
Q4. Is Simpson’s Paradox related to correlation?
Answer: Yes. The phenomenon can involve changes in correlations or associations when observations from different groups are combined.
Recommended Articles
We hope that this EDUCBA information on “Simpson’s Paradox” was beneficial to you. You can view EDUCBA’s recommended articles for more information