Updated July 25, 2023
Definition of Return on Average Assets
The term “return on average assets,” or ROAA, refers to the financial metric that helps assess how effectively a company utilizes its assets to generate a net profit.
Simply put, this metric indicates the asset intensity of a company, such that a higher value of ROAA indicates lower asset intensity and vice versa.
Formula
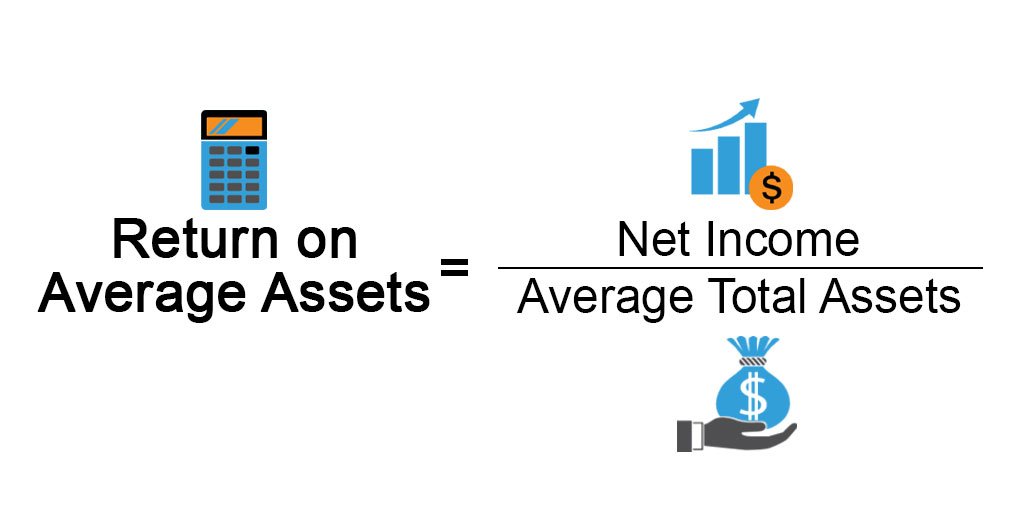
The formula for ROAA can be derived by dividing the net income by the average total assets, which is then expressed in percentages. The mathematical representation of the formula is as below:
While net income is easily available as a separate line item in the income statement, average total assets can be computed as the average of the total assets at the beginning and end of the year.
Examples of Return on Average Assets (With Excel Template)
Let’s take an example to understand the calculation of Return on Average Assets in a better manner.
Example #1
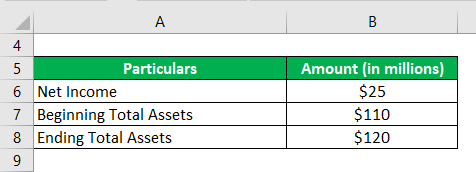
Let us take the example of a company that manufactures soft drinks bottles and has its unit in the village of Wheeling, IL (US). The company generated a net income of $25 million during the year 2018, while its total assets stood at $110 million at the start of the year and ended the year at $120 million. Based on the given information, calculate the ROAA of the company for the year 2018.
Solution:
The formula to calculate Average Total Assets is as below:
Average Total Assets = (Beginning Total Assets + Ending Total Assets) / 2
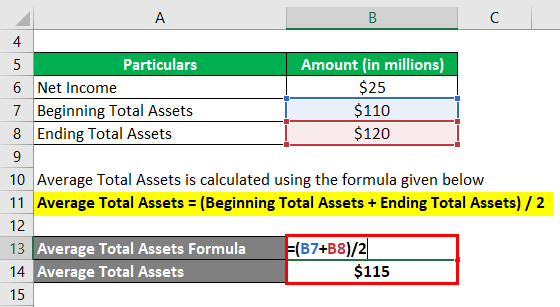
- Average Total Assets = ($110 million + $120 million) / 2
- Average Total Assets = $115 million
The formula to calculate Return on Average Assets is as below:
Return on Average Assets = Net Income / Average Total Assets
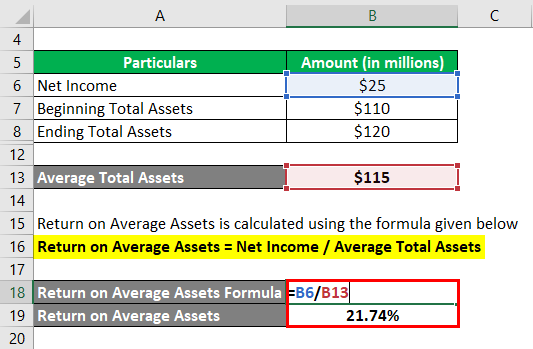
- Return on Average Assets (ROAA) = $25 million / $115 million
- = 21.74%
Therefore, the company managed an ROAA of 21.74% during the year 2018.
Example #2
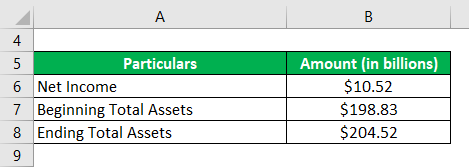
Let us take the example of Walmart Inc. to illustrate the computation of ROAA. During 2018, the company generated a net income of $10.52 billion, and its total assets at the beginning and the end of the year were $198.83 billion and $204.52 billion, respectively. Calculate Walmart Inc.’s ROAA for 2018 based on the information.
Solution:
The formula to calculate Average Total Assets is as below:
Average Total Assets = (Beginning Total Assets + Ending Total Assets) / 2
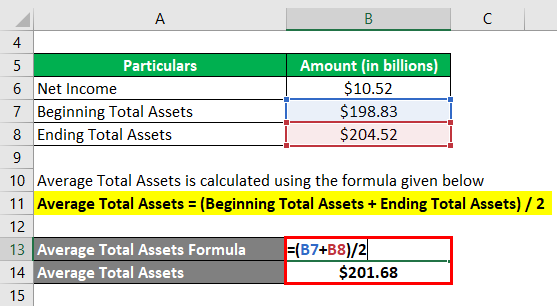
- Average Total Assets = ($198.83 billion + $204.52 billion) / 2
- Average Total Assets = $201.68 billion
The formula to calculate Return on Average Assets is as below:
Return on Average Assets = Net Income / Average Total Assets
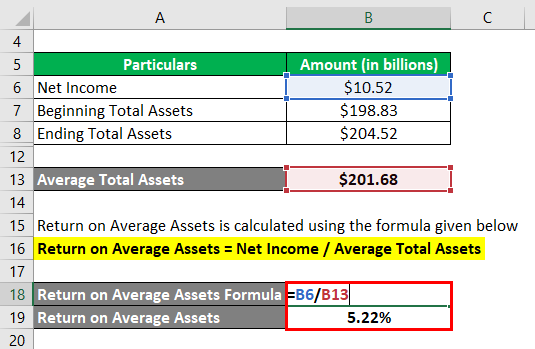
- Return on Average Assets = $10.52 billion / $201.68 billion
- = 5.22%
Therefore, Walmart Inc.’s ROAA for the year 2018 stood at 5.22%.
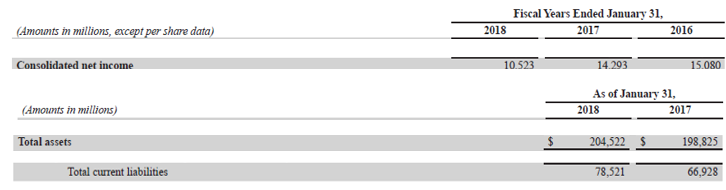
Source: Walmart Annual Reports (Investor Relations)
Example #3
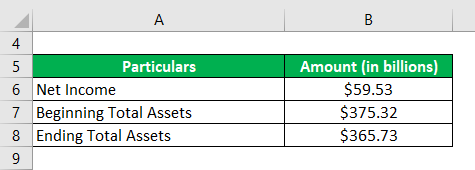
Let us now take Apple Inc.’s example to illustrate the ROAA concept. During 2018, the company generated a net income of $59.53 billion, while its total assets at the start and end of the year were $375.32 million and $365.73 billion, respectively. Calculate Apple Inc.’s ROAA for 2018 based on the information.
Solution:
The formula to calculate Average Total Assets is as below:
Average Total Assets = (Beginning Total Assets + Ending Total Assets) / 2
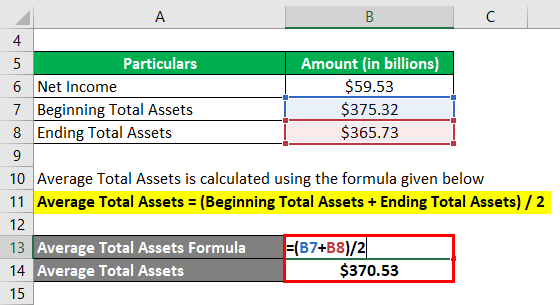
- Average Total Assets = ($375.32 billion + $365.73 billion) / 2
- Average Total Assets = $370.53 million
The formula to calculate Return on Average Assets is as below:
Return on Average Assets = Net Income / Average Total Assets
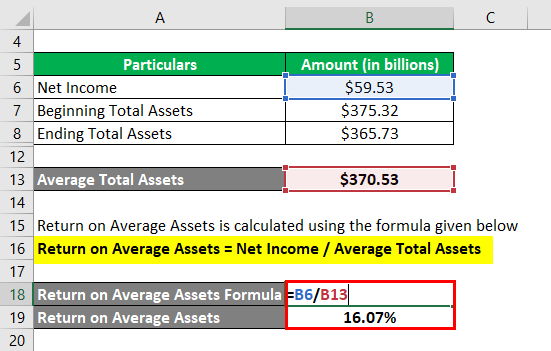
- Return on Average Assets = $59.53 billion / $370.53 million
- = 16.07%
Therefore, Apple Inc.’s ROAA for the year 2018 stood at 16.07%.
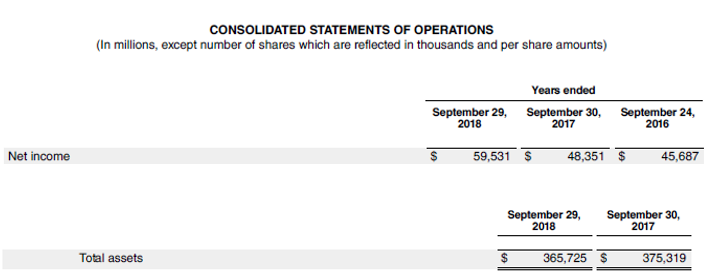
Source Link: Apple Inc. Balance Sheet
Advantages of Return on Average Assets
- The ratio computation is very easy since both net income and average assets are easily available from the annual report.
- It assesses the company’s ability to utilize its assets to generate profits.
Limitations of Return on Average Assets
- In the case of peer comparison, this ratio can’t be used for comparing the performances of companies operating in different industries.
- The ratio assumes asset value at the beginning and end of the period reflects the asset value experienced on a regular basis, which is not always the case.
Conclusion
So, it can be seen that ROAA is a financial metric used by investors to assess how well a company can utilize its assets for profit maximization. The financial ratio focuses on the fact that net and gross profit margins are insufficient to analyze a company. As an investor, you should also know the ability of the company to utilize its assets to generate profits.
Recommended Articles
This is a guide to Return on Average Assets. Here we discuss how to calculate ROAA along with practical examples. We also provide a downloadable Excel template. You may also look at the following articles to learn more-

