Updated February 17, 2023
Introduction to Redis Monitor
Redis monitor is used for debugging commands which streams every process of command by using the server of redis. It helps us to understand what is going onto the database server. We can use the redis monitor command by using redis cli also we can use the same by using telnet. The ability for checking all the process requests from the server is useful for spotting bugs.

Key Takeaways
- At the time of using redis cli we need to access SSH into our account. To use this we need the socket address of redis which we can find in the panel of redis.
- We are using multiple metrics like performance to define the redis monitor.
What is Redis Monitor?
Using CLI, we can monitor the redis. CLI is a command line interface for redis. It is a simple program that allows you to send commands to the redis server and read the responses that were sent by the server directly from the terminal. We can monitor metrics, which will help us improve the performance of the redis database. Redis monitoring performance issues are critical. Redis is well known for its low latency response time when running a large number of queries.
How to Use Redis Monitor?
First, we need to install the database of the server. The below steps shows how we can use the monitor as follows:
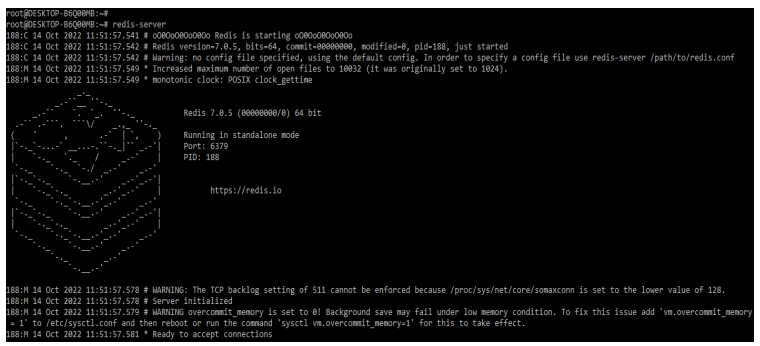
1. At the time of using monitor we are starting the database server of redis using the below command as follows.
Command:
redis-serverOutput:
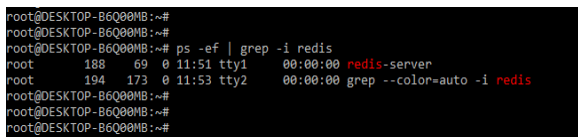
2. Below we are checking the process of the database server. We can also check the port no of the database server.
Command:
ps -ef | grep -i redisOutput:
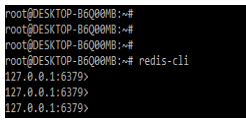
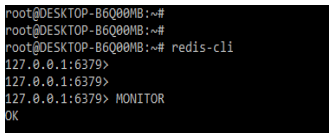
3. In the below example we are logging to the database server by using the command as follows.
Command:
redis-cliOutput:
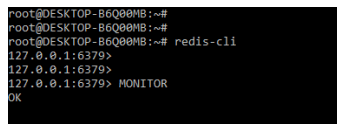
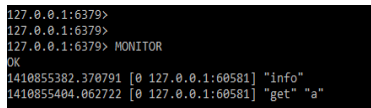
4. In the below example we can see that we used the monitor command to define the health of the database server as follows.
Command:
MONITOROutput:
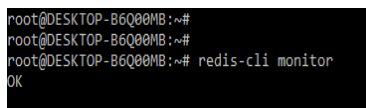
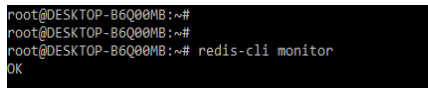
5. We can also use the monitor command by using redis-cli command. The below example shows how we can use redis-cli command with the monitor command as follows.
Command:
redis-cli monitorOutput:
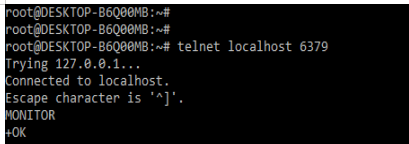
6. We can also monitor the database server by using the telnet command.
Command:
telnet localhost 6379Output:
Redis Monitor Database
As we know that redis is a NoSQL database system that is very fast and flexible with data structures. Redis will excel in multiple areas like caching, session management, gaming, and many more. Basically, the redis dataset is stored entirely in the memory which contributes to response time in milliseconds.
The best way for ensuring stable and healthy systems is to set up the tool of it and provide monitoring of all the metrics of the database server. We can provide the metrics for performance, memory, and other metrics of the database server. The application will manage a few of the redis database monitoring parameters.
The syntax of the redis database monitor command is as follows:
Syntax:
MONITORWe can monitor the performance of the database server in redis by using the monitor command as follows:
Command:
MONITOROutput:
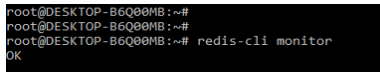
We can check all database performance by using the redis-cli command. We are using the monitor command with redis-cli as follows. It will give an ok response to us if our database server is in a healthy state.
Command:
redis-cli monitorOutput:
Basically, redis is an in-memory key-value data store known for its performance and ease of use. We can say that the redis database is an alternative to the disk-based databases that we are currently using. Redis will offer a diverse set of database primitives and commands.
Redis Server Monitor Command
To monitor the redis database server, we use several commands. Monitor is the most commonly used command for monitoring a Redis database server. We can use the monitor command with redis-cli as well as by entering it into the redis-cli command. The example below shows using both redis-cli and the command line.
Command:
redis-cli monitorOutput:
We can also monitor the database performance by defining the command MONITOR as follows:
Command:
MONITOROutput:
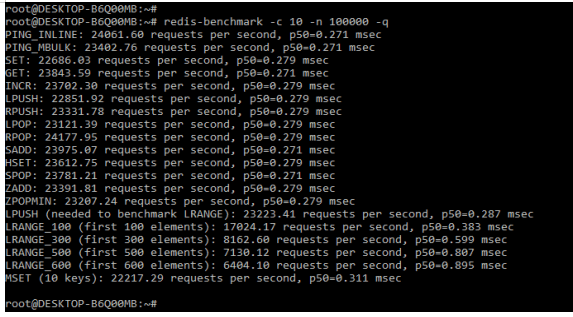
By using the below command, we can find the cost of running the monitor command as follows. The below example shows how much costs will be consumed.
Command:
redis-benchmark -c 10 -n 100000 –qOutput:
Redis Monitor Metrics
Monitoring the redis server will help us to find the problems, we can find the problems which arise in the infrastructure.
Below are the metrics which are available in the redis as follows:
1. Performance Metrics
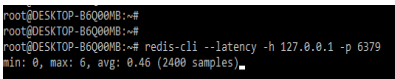
The user experience will be poor due to database performance issues. The performance of the Redis database can be measured using CPU time, hit rate, and latency. Latency is an important metric in redis that was used to measure its performance of redis. The following example shows how we can measure performance using latency.
Command:
redis-cli --latency -h 127.0.0.1 -p 6379Output:
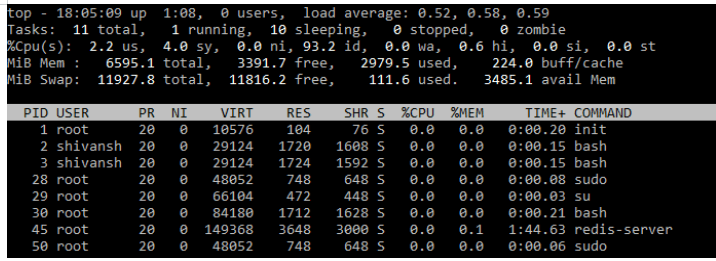
We can check the CPU usage of redis database server by using the top command. Given below is the example to check the CPU usage.
Command:
topOutput:
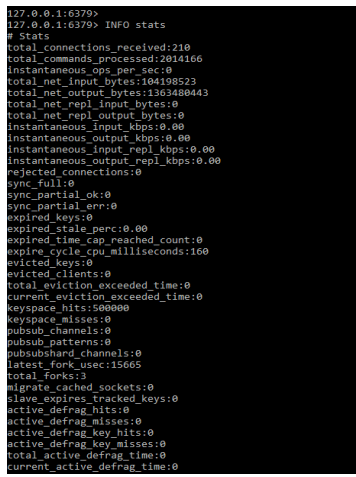
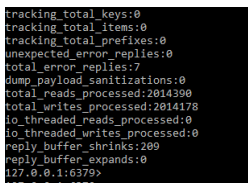
We can also check the cache hit ratio in the redis server. We can check the cache hit ratio by using the following command as follows.
Command:
INFO statsOutput:
2. Memory Metrics
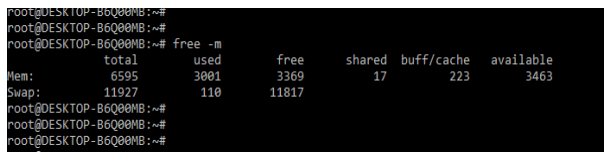
Memory is a critical resource for redis. The performance of redis depends on the memory resources. We can check the usage of memory by using the below command as follows.
Command:
free –mOutput:
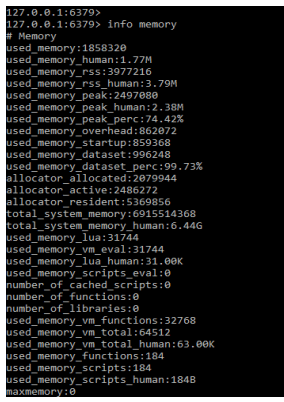
We can define the memory fragmentation ratio by using the following command as follows. We can define the memory fragmentation ratio by using OS which was used in redis.
Command:
Info memoryOutput:
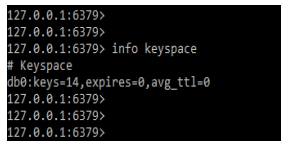
3. Basic Activity Metrics
Apart from the memory and performance metrics, it is very useful to know other metrics of the database server. We can check the basic metrics by using the below commands as follows.
Command:
info keyspaceOutput:
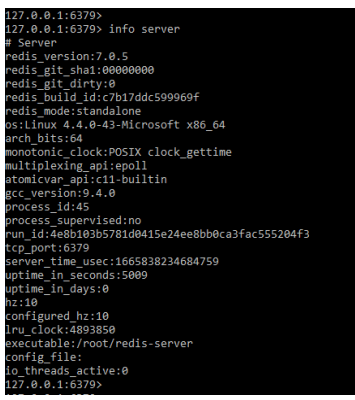
4. Server Metrics
We are collecting the server metrics by using the following command as follows.
Command:
info serverOutput:
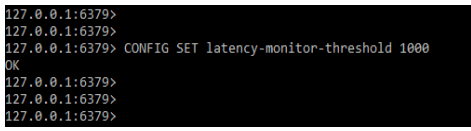
5. Server Latency Monitor
We can check the server latency monitor by using the below command as follows.
Command:
CONFIG SET latency-monitor-threshold 1000Output:
FAQ
Given below are the FAQs mentioned:
Q1. What is the use of redis monitor?
Answer: It is basically a debugging command that streams back every command that was processed by the redis server. Using the monitor command, we can debug what is happening on the database server.
Q2. How many metrics are we using?
Answer: We are using metrics such as performance, memory, basic activity, and server metrics.
Q3. Which command we are using in the redis monitor?
Answer: We are using monitor and redis-cli monitor and telnet command to define the metrics of it.
Conclusion
Redis monitoring performance issues are critical. Redis is well known for its low latency response time when running a large number of queries. It is used for debugging commands that streams every command process using the redis server.
Recommended Articles
This is a guide to Redis Monitor. Here we discuss the introduction, how to use redis monitor? database, metrics, and FAQ. You may also have a look at the following articles to learn more –
