
Difference Between Qualitative vs Quantitative Data
The analysis in any research project involves summarizing the mass of information that has been collected and presenting the end results in such a way that it communicates the foremost necessary findings or options. For example, if a vesture complete is making an attempt to spot the most recent trends among young girls, the complete can initially reach young girls and raise their queries relevant to the analysis objective. Once collecting this information, the vesture can analyze the data to spot patterns – for example, it should discover that almost all young girls would really like to examine additional sort of jeans. There are many alternative data analysis ways, but the two most commonly and majorly used are Qualitative and Quantitative Analysis.
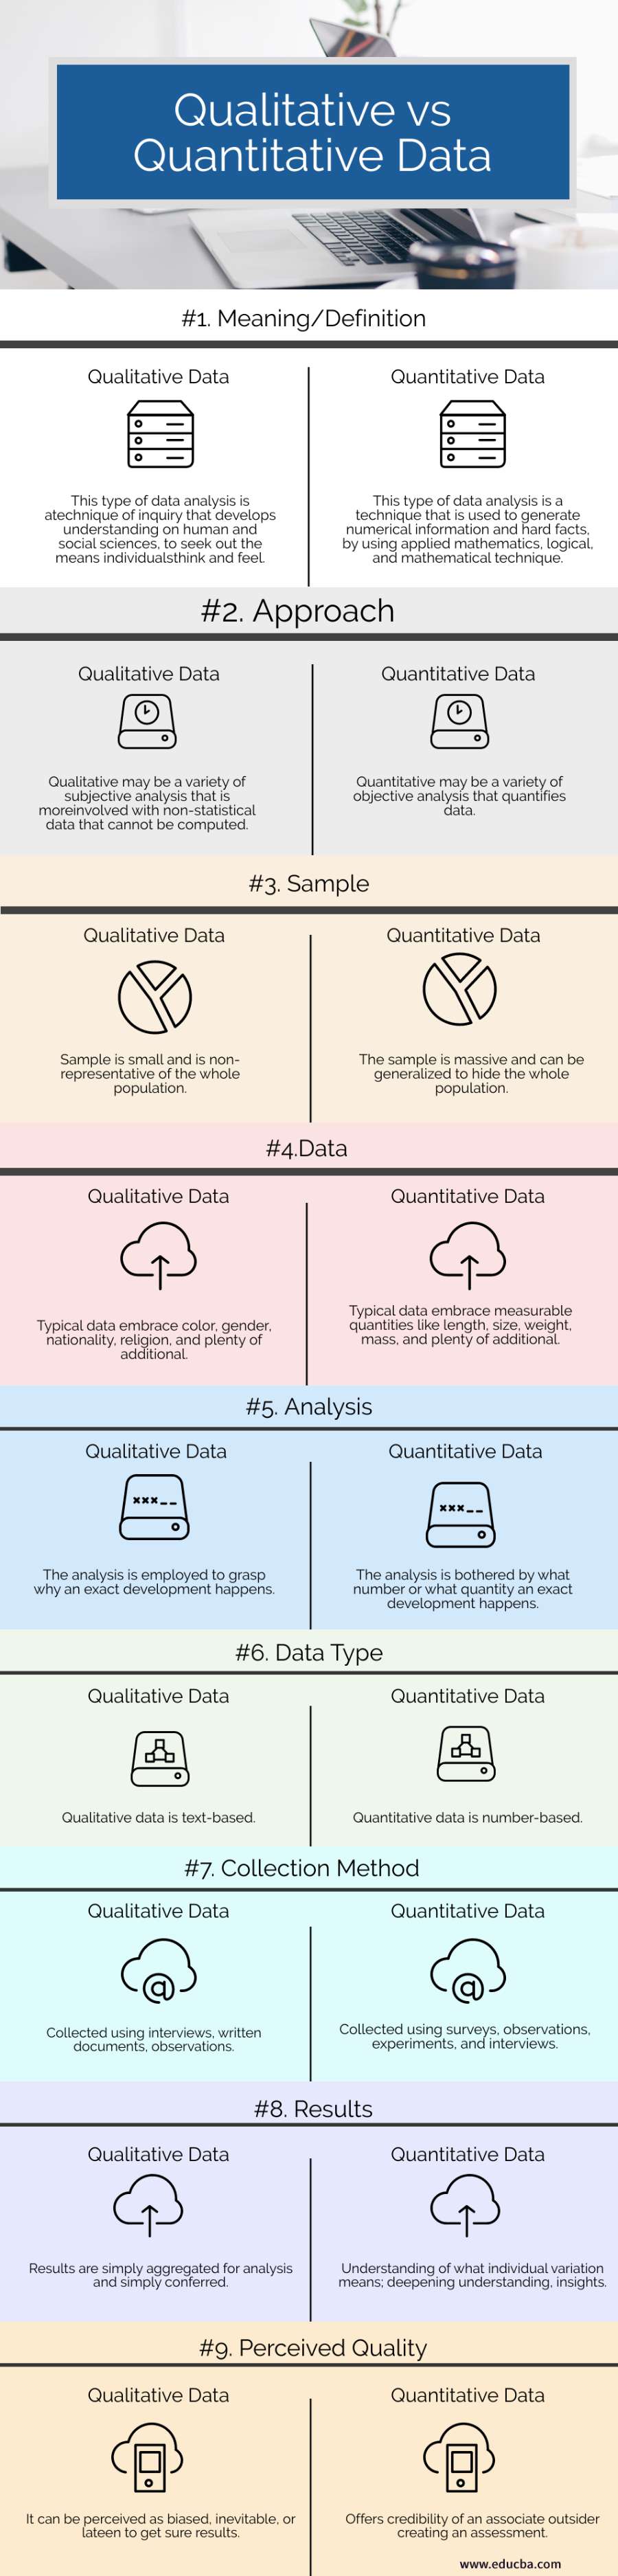
Head to Head Comparison between Qualitative vs Quantitative Data (Infographics)
Below are the top 8 differences between Qualitative vs Quantitative Data:
Key Differences between Qualitative vs Quantitative Data
One variety of data is objective, up-to-the-point, and conclusive. The other variety of data is subjective, interpretive, and explained easily. Quantitative data can be counted, measured, and expressed using numbers. Qualitative data is descriptive and abstract and may be classified on traits and characteristics. The key variations between Qualitative and Quantitative data are as prescribed below:
- The data type, in which the classification of objects is based on attributes (quality) is called qualitative data. The type of information that might be counted and expressed in numbers and values is called quantitative data.
- Quantitative data relies on numbers. Simple arithmetic or additional advanced applied mathematics analysis is employed to get commonalities or patterns within the information. The results are usually seen in graphs and tables. Applications like Excel, SPSS, or R can be accustomed to calculate things like Average scores, range of times a specific answer was given, the correlation between two or additional variables, dependability, and validity of the results.
- The approach to the inquiry within the case of qualitative data is subjective and holistic, whereas quantitative information has an associative objective and targeted approach.
- Qualitative data determines the depth of understanding, whereas quantitative data ascertain the amount of prevalence.
- In qualitative data, the sample size is small and is drawn from non-representative samples. Conversely, the sample size is massive in quantitative data drawn from the representative sample.
- Qualitative data develops initial understanding, i.e. it defines the matter. In contrast to quantitative data, which recommends the ultimate course of action.
- In the Qualitative kind, verbal data is collected. Conversely, in the quantitative kind, measurable data is gathered.
- Qualitative analysis and data is conducted with the aim of exploring and discovering concepts utilized in the continuous processes. As hostile quantitative analysis data, the aim is to look at cause and result relationships between variables.
- Elements utilized in the analysis of qualitative research are words, pictures, and objects whereas that quantitative analysis are of numerical information.
- Lastly, qualitative data develops the initial understanding whereas, quantitative data recommends a final course of action.
Qualitative VS Quantitative Data
|
Criteria |
Qualitative Data |
Quantitative Data |
| Meaning/Definition | This type of data analysis is a technique of inquiry that develops an understanding of human and social sciences, to seek out the means individuals think and feel. | This type of data analysis is a technique that is used to generate numerical information and hard facts, by using applied mathematics, logical, and mathematical technique. |
| Approach | Qualitative may be a variety of subjective analysis that is more involved with non-statistical data that cannot be computed. | Quantitative may be a variety of objective analysis that quantifies data. |
| Sample | Sample is small and is non-representative of the whole population | The sample is massive and can be generalized to hide the whole population. |
| Data | Typical data embrace color, gender, nationality, religion, and plenty of additional. | Typical data embrace measurable quantities like length, size, weight, mass, and plenty of additional. |
| Analysis | The analysis is employed to grasp why an exact development happens. | The analysis is bothered by what number or what quantity an exact development happens. |
| Data Type | Qualitative data is text-based. | Quantitative data is number-based. |
| Collection Method | Collected using interviews, written documents, observations. | Collected using surveys, observations, experiments, and interviews. |
| Results | Results are simply aggregated for analysis and simply conferred. | Understanding of what individual variation means; deepening understanding, insights. |
| Perceived Quality | It can be perceived as biased, inevitable, or lateen to get sure results. | Offers credibility of an associate outsider creating an assessment. |
Qualitative vs Quantitative Data Comparison Table
Let us discuss the top comparison between Qualitative vs Quantitative Data:
|
Purpose |
Qualitative Data |
Quantitative Data |
| Hypothesis | Tentative, Evolving, supports a specific study. | Specific, testable, explicit before a specific study. |
| Sampling | Purposive: Intent to pick out “small”, not essentially representative, sample so as to induce in-depth understanding. | Random: Intent to pick out “large”, representative sample so as to generalize results to a population. |
| Research Setting | Controlled setting not as necessary. | Controlled to the degree potential. |
| Approach to Inquiry | Subjective, holistic, process-oriented | Objective, focused, outcome-oriented. |
| Data Interpretation | Conclusions are tentative (can change), reviewed on an ongoing basis, conclusions are generalizations. The validity of the interferences/generalizations is the reader’s responsibility. | Conclusions and generalizations formulated at the end of the study stated with a pre-determined degree of certainty. Interferences/generalizations are the researcher’s responsibility. |
| Design and Method | Flexible, specified only in general terms in advance of study Non-intervention, minimal disturbance, all descriptive – History, Biography, Ethnography, Phenomenology, Grounded Theory, Case Study. Consider many variables, small groups. | Structured, inflexible, specified in detail in advance of study Intervention, manipulation, and control Descriptive Correlation, Casual-Comparative, Experimental. Consider a few variables, large group. |
| Measurement | Non-standardized, narrative (written word), ongoing | Standardized, numerical (measurements, numbers), at the end. |
| Statistical Analysis | Statistical Analysis in Qualitative data is a bit difficult to achieve than Quantitative data. | Statistical analysis in Quantitative data is easier to achieve than Qualitative data. |
The main difference between qualitative and quantitative data is that qualitative data is descriptive, while quantitative data is numerical. Usually, statistical analysis is easier with quantitative data than qualitative data. Statistics, social sciences, computing are some disciplines that use this type of data. You must consider that there are qualitative shades in the quantitative instrument, but not to be confused with qualitative, precisely for the reasons that have been specified so far.
Recommended Articles
This is a guide to the top differences between Qualitative vs Quantitative Data. Here we also discuss the key differences with infographics and comparison tables. You may also have a look at the following articles to learn more –
