Updated May 6, 2023

Introduction to Python Z Test
The following article provides an outline for Python Z Test. In the vast field of statistics, the process of hypothesis testing plays a very major role. Hypothesis testing helps to decide on a statistics assumption. When a hypothesis is formed, hypothesis testing is used to confirm how close the assumption is to reality. This is the key characteristic of hypothesis-based testing. The Z test is a method or a type of testing used in hypothesis testing.
The Z test involves determining the P-value and then verifying how close the determined P-value is to the significant value. Usually, the significance value is around 0.05. The P value stands for the representation of the probability value identified. The probability value mentions how possible the determined assumption is a null hypothesis or an alternative hypothesis. So based on the P value determined, the reality of the hypothesis assumption is validated. This is the critical process of the Z test.
Z Test Syntax
Given below is the syntax mentioned:
statsmodels.stats.weightstats.ztest(x1, x2=None, value=0, alternative='two-sided', usevar='pooled', ddof=1.0)- The Z test model can take two independent samples to process and determine the p-value. The x1 will be the first independent sample used in the above syntax. Therefore, the x1 must be keyed as an array in one dimensional or two-dimensional format.
- The x2 will be the second independent sample used in the above syntax. The x2 must be keyed as an array in a one-dimensional or two-dimensional format.
- The value will hold the mean of X1, which forms the alternative hypothesis. When more than one independent variable is used, this value will be the mean of the difference between X1 and X2.
- The user holds the value pooled, meaning the samples’ standard deviation is the same.
- H1 refers to the alternative hypothesis.
- ddof is used for mean estimate calculation.
When to Perform Z Test in Python?
- First, the sample size determines when the Z test needs to be performed. This means whenever the sample size is more significant than 30 records, the Z test is preferred. So the sample size plays a key in Z test determination. When the number of sample records involved is lesser than 30, then the t-test is preferred over the Z test.
- Every data point involved needs to be independent of each other. This means both the data points involved in the Z test need to be self-governing, then the data used must be suitable for the Z test. This is another key functionality for considering the Z test in Python.
- The normal distribution of the data is expected. Especially for smaller sample sizes, this needs to be strictly followed. The normal distribution of the sample sizes is a critical factor for this Z test selection. When the sample size exceeds 30 records, it can be considered without the normal distribution.
- The method of sampling is another crucial factor used. This determines how precise the hypothesis is calculated. Here we need to ensure the data selected in the sample is well distributed and chosen randomly. So from a large set of population, it is necessary to ensure the data is well shuffled and selected from this large set so that all aspects of the population can be covered in the sample set.
Examples of Python Z Test
Given below are the examples of the Python Z Test:
Data Used ( BP.csv ):
| patient_name | patient_ sex | patient_agegrp | patient_bp_before | patient_bp_after |
| 1 | Male | 30-45 | 142 | 153 |
| 2 | Male | 30-45 | 163 | 170 |
| 3 | Male | 30-45 | 143 | 168 |
| 4 | Male | 30-45 | 153 | 142 |
| 5 | Male | 30-45 | 146 | 141 |
| 6 | Male | 30-45 | 150 | 147 |
| 7 | Male | 30-45 | 158 | 133 |
| 8 | Male | 30-45 | 153 | 141 |
| 9 | Male | 30-45 | 153 | 131 |
| 10 | Male | 30-45 | 158 | 125 |
| 11 | Male | 30-45 | 169 | 164 |
| 12 | Male | 30-45 | 173 | 159 |
| 13 | Male | 30-45 | 165 | 135 |
| 14 | Male | 30-45 | 145 | 159 |
| 15 | Male | 30-45 | 133 | 153 |
| 16 | Male | 30-45 | 152 | 126 |
| 17 | Male | 30-45 | 141 | 162 |
| 18 | Male | 30-45 | 176 | 134 |
| 19 | Male | 30-45 | 143 | 136 |
| 20 | Male | 30-45 | 162 | 150 |
| 21 | Male | 46-59 | 149 | 168 |
| 22 | Male | 46-59 | 156 | 155 |
| 23 | Male | 46-59 | 151 | 136 |
| 24 | Male | 46-59 | 159 | 132 |
| 25 | Male | 46-59 | 164 | 160 |
| 26 | Male | 46-59 | 154 | 160 |
| 27 | Male | 46-59 | 152 | 136 |
| 28 | Male | 46-59 | 142 | 183 |
| 29 | Male | 46-59 | 162 | 152 |
| 30 | Male | 46-59 | 155 | 162 |
| 31 | Male | 46-59 | 175 | 151 |
| 32 | Male | 46-59 | 184 | 139 |
| 33 | Male | 46-59 | 167 | 175 |
| 34 | Male | 46-59 | 148 | 184 |
Example #1
Code:
import pandas as pd
from statsmodels.stats import weightstats as stests
dataframe = pd.read_csv(r"C:\Users\ANAND\Desktop\BP.csv")
dataframe[['patient_bp_before','patient_bp_after']].describe()
ztest ,propability_value = stests.ztest(dataframe['patient_bp_before'], x2=None, value=146)
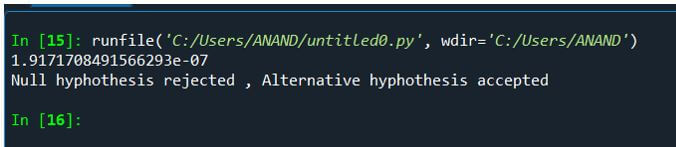
print(float(propability_value))
if propability_value<0.05:
print("Null hyphothesis rejected , Alternative hyphothesis accepted")
else:
print("Null hyphothesis accepted , Alternative hyphothesis rejected")Output:
Explanation:
- In this first example, the following assumptions are made.
- Alternative Hypothesis: All patients’ average BP ranges around 146 in before.
- Null Hypothesis: All patients’ average BP does not provide a range in the given mean value.
- When the probability value is determined, and the hypothesis is evaluated, the probability values lie somewhere around -1.91, less than the 0.05 significance level; hence, this is considered an Alternative hypothesis. Therefore the assumption is successful.
Example #2
Code:
# The Mean value is alone manipulated as 78
ztest ,propability_value = stests.ztest(dataframe['patient_bp_before'], x2=None, value=146)
Output:
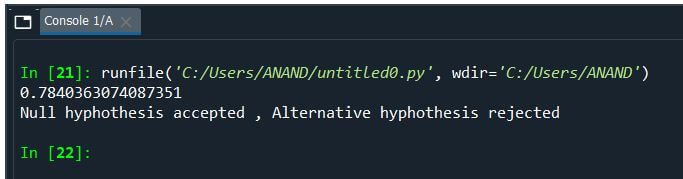
Explanation:
- In this second example, the following assumptions are made.
- Alternative Hypothesis: All patients’ average BP ranges around 78 in before.
Null Hypothesis: All patients’ average BP does not provide a range in the given mean value. - When the probability value is determined, and the hypothesis is evaluated, the probability values lie somewhere around +0.78, more significant than the 0.05 significance level; hence, this is considered a Null hypothesis. Thus the assumption has failed.
Conclusion
Among the different methods for hypothesis testing, the Z test is one of the most stable methods used. This method offers much flexibility in determining the p-value involved and identifying the type of hypothesis happening. So, the presence of the Null hypothesis or alternative hypothesis can be flexibly calculated.
Recommended Articles
This is a guide to Python Z Test. Here we discuss the introduction, when to perform the z test in Python, and examples for better understanding. You may also have a look at the following articles to learn more –

