Updated April 15, 2023
Difference Between Prometheus vs Influxdb
Prometheus is an open-source and strong community-driven software under Apache license, which is used as a monitoring solution and alert toolkit. It developed in 2012 and became quite popular as many organizations have started adopting this tool citing various advantages. InfluxData develops Influxdb, and its main purpose is to store mainly time series data in its database. Influxdb is mainly used in monitoring applications and infrastructure and is also used in data analysis. It is written in Go, and this is also quite popular among organizations. So let us see in this article how these two monitoring solutions relate or differ from each other.
Head to Head Comparison between Prometheus vs Influxdb (Infographics)
Below are the top 5 differences between Prometheus vs Influxdb:
Key Differences between Prometheus vs Influxdb
Following are the key differences between Prometheus vs Influxdb:
- Even though both Prometheus and influxdb are used as a monitoring solution, there are many differences between the two and below are a few of them.
- Even though both platforms can be used to monitor time-series data when it comes to alerting or even data visualization, inlfuxdb cannot be directly used; we need to incorporate other tools for alerting and visualization tasks. Few tools are chronograph for visualization and capacitor for alerting. Infulxdb is more know as a time-series database. Prometheus uses an alert manager for these notifications tasks. Deduplication, silencing, and grouping is a few features provided by the alert manager of Prometheus.
- Now when we consider scaling, then there is quite a huge difference between Prometheus and influxdb. Influx DB’s commercial segment is distributed in nature and thus will be having many interconnecting nodes. So when the server scales up, we need not worry about scaling nodes. Thus if you are processing complex loads, then influxdb nodes can be considered redundant. This is a contrasting feature when compared to Prometheus. Prometheus server is independent, so when the load increases, then we need to scale up our monitoring Prometheus servers as well. Thus for the simpler load, we can go for the Prometheus server.
- Now there is a difference as well in the way we query on these platforms. Both have their only query language know as InflusQL and PromQL. InfluxQL is very much similar to traditional SQL, and querying is quite easy. PromQL is more of a functional language for querying. For associates with SQL, skills will be comfortable with InfluxQL, but PromQL is not that difficult. Thus bot querying Langues is efficient in querying the records from the stored data.
Prometheus vs Influxdb Comparison Table
Let us look at the comparison table of Prometheus vs Influxdb, where we weigh both platforms based on different features.
| Feature | Prometheus | Influxdb |
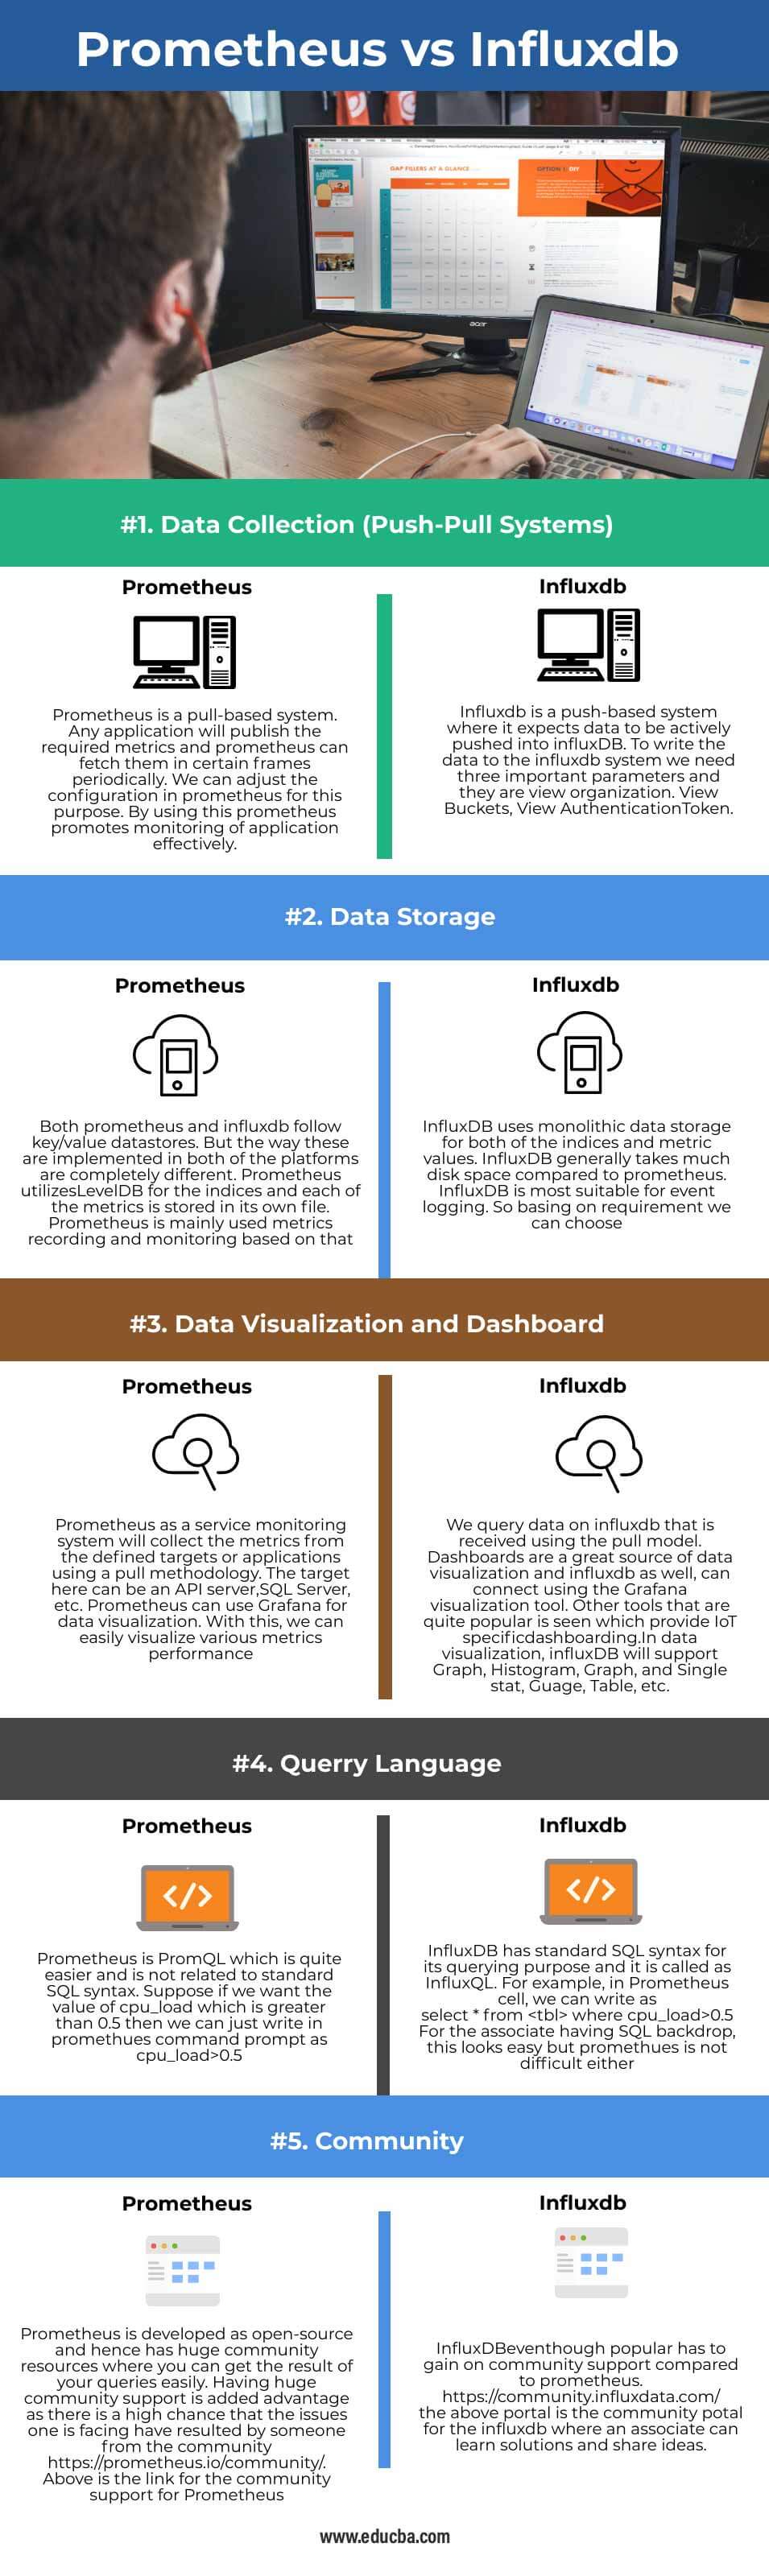
| Data collection (Push-Pull Systems) | Prometheus is a pull-based system. Any application will publish the required metrics, and Prometheus can fetch them in certain frames periodically.
We can adjust the configuration in Prometheus for this purpose. By using this, Prometheus promotes monitoring of application effectively. |
Influxdb is a push-based system where it expects data to be actively pushed into influxDB. To write the data to the influxdb system, we need three important parameters: view organization. View Buckets, View AuthenticationToken. |
| Data Storage | Both Prometheus and influxdb follow key/value datastores. But the way these are implemented in both of the platforms are completely different. Prometheus utilizesLevelDB for the indices and each of the metrics are stored in its own file. Prometheus is mainly used metrics recording and monitoring based on that. | InfluxDB uses monolithic data storage for both the indices and metric values. InfluxDB generally takes much disk space compared to Prometheus. InfluxDB is most suitable for event logging. So based on requirement we can choose |
| Data Visualization and Dashboard | As a service monitoring system, Prometheus will collect the metrics from the defined targets or applications using a pull methodology. The target here can be an API server, SQL Server, etc. Prometheus can use Grafana for data visualization. With this, we can easily visualize various metrics performance. | We query data on influxdb that is received using the pull model. Dashboards are a great source of data visualization and influxdb and can connect using the Grafana visualization tool. Other tools that are quite popular is seen which provide IoT specific dashboarding. In data visualization, influxDB will support Graph, Histogram, Graph, and Single stat, Guage, Table, etc. |
| Querry Language | Prometheus is PromQL which is quite easier and is not related to standard SQL syntax. Suppose if we want the value of cpu_load which is greater than 0.5, then we can just write in Prometheus command prompt as cpu_load>0.5 | InfluxDB has standard SQL syntax for its querying purpose, and it is called InfluxQL. For example, in Prometheus cell, we can write as select * from <tbl> where cpu_load>0.5. For the associate having SQL backdrop, this looks easy but Prometheus is not difficult either. |
| Community | Prometheus is developed as open-source and has huge community resources where you can easily get the result of your queries. Having huge community support is added advantage as there is a high chance that the issues one is facing have resulted from someone from the community.
Here is the link for the community support for Prometheus. |
InfluxDBeventhough popular has to gain on community support compared to Prometheus.
Here the portal is the community portal for the influxdb where an associate can learn solutions and share ideas. |
Conclusion
Thus if you are looking for monitoring solutions for time series data among Prometheus and influxdb, you can weigh upon the factors mentioned in this article and decide which one to use depending on your use case. Both platforms are quite popular among organizations when it comes to monitoring services for time series data. Some people argue that PromQL is new and InfluxQL is quite SQL like hence will be better, but that is not the case. PromQL is much easier for querying, and you can go for it. You can choose Prometheus as it has a lot more integrations and features. But you are looking for something specific for IoT, Sensors, and other analytics, then influxdb is a better choice.
Recommended Articles
This is a guide to Prometheus vs Influxdb. Here we also discuss the Prometheus vs Influxdb key differences with infographics and comparison table. You may also have a look at the following articles to learn more –
