Updated July 4, 2023
Introduction to Statistical Analysis with R
Statistical Analysis with R is one of the best practices which statisticians, data analysts, and data scientists do while analyzing statistical data. The r language is a popular open-source programming language that extensively supports built-in packages and external packages for statistical analysis. R language natively supports basic statistical calculations for exploratory data and advanced statistics for predictive data analysis. Statistical analysis with R is an important part of identifying data patterns based on the statistical rules and business constraints due to the simplicity of R syntax and the flexibility of using advanced packages.
How to Perform Statistical Analysis with R language?
Let us now discuss how to perform Statistical Analysis with R language.
- To start with statistical data analysis with R, the business requirement needs to be clear to find the data patterns from the available data.
- The installable file for R can be downloaded from https://cran.r-project.org/.
- Next, the IDE, such as R Studio, needs to be installed on the system.
- R Studio provides GUI support along with some enterprise-ready features like Syntax hiliting, debugging, packages, and workspace management.
- R Studio can be downloaded and installed from https://posit.co/
- For Example, we will import a .csv file to R studio for Statistical analysis.
-
- We will be downloading an open-source data set from https://www.kaggle.com/ for this demonstration.
- The data file we will use is ‘cbb.csv,’ which is a college basketball dataset,
-
The practical approach of statistical analysis with R
- This section will do hands-on using R studio for the college basketball dataset.
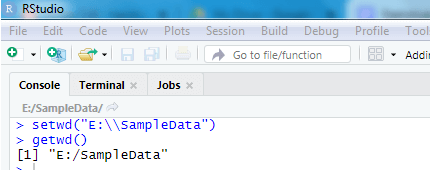
- The first step is to set the working directory, which will be used as the preferred location to read and write datasets.
- setwd() is used in R to set the working directory
- getwd() to check the present working directory
- Following is a screenshot of R Studio with setwd() and getwd() functions.
setwd("E:\\SampleData")

getwd()
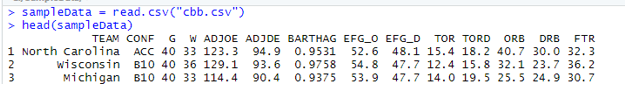
- Next will import the data set using read.csv() command and assign it to a data frame called SampleData as the following the syntax
- Sample data = read.csv(“cbb.csv”)
- To check the dataset imported correctly and review the few top lines of data, use the head() command in R
sampleData = read.csv("cbb.csv")

head(sampleData)
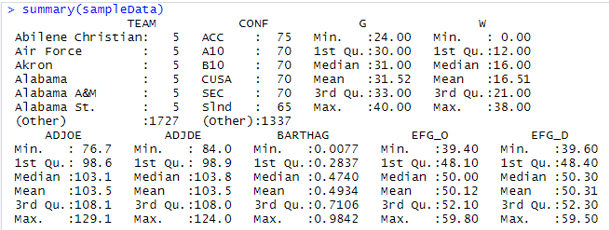
- Next, we will use a summary() command to do basic statistical analysis, which will show the Min, Max, Mean, median, and interquartile range information about the data set for each quantitative variable.
- The summary of the basketball data set shows that Variable G has min value of 24.00, Max values 40.00, a median value is 31.00, and a mean value is 31.52
summary(sampleData)
- Next, we will discuss univariate data analysis.
- R data frames are an efficient data store reference,
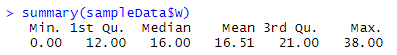
- For example, to view the statistical summary of the W variable, we will use
summary(sampleData$W)
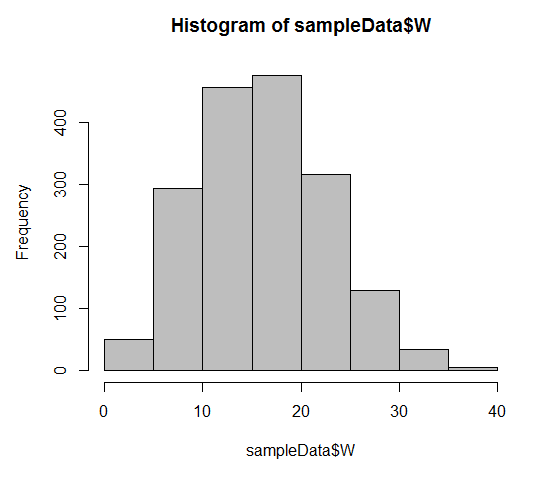
- The data can be plotted as a histogram using the hist. default() command to view the overall data distribution
hist.default(sampleData$W,col='gray')
- We can use the Table function to create a frequency table that shows the number of frequency of the data in the variable using the table(sampleData$W)
table(sampleData$W)
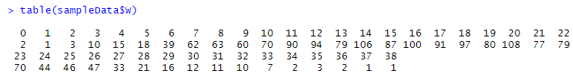
- The frequency table shows the value 20 has a maximum frequency in the data. This function is very useful while doing statistical categorical variables.
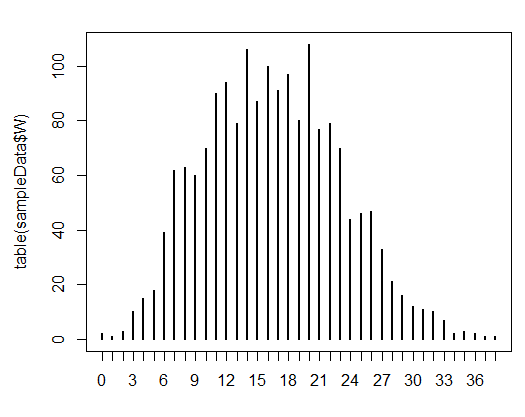
- Also, we n plat this frequency table using the plot function in R using >
plot(table(sampleData$W))
- Next, we will discuss bivariate statistical analysis with R
- This statistical analysis is a comparison between two variables present in that data set.
- It helps to identify the correlation and patterns between the two variables.
- Symbol ‘~’ is used for bivariate analysis in R
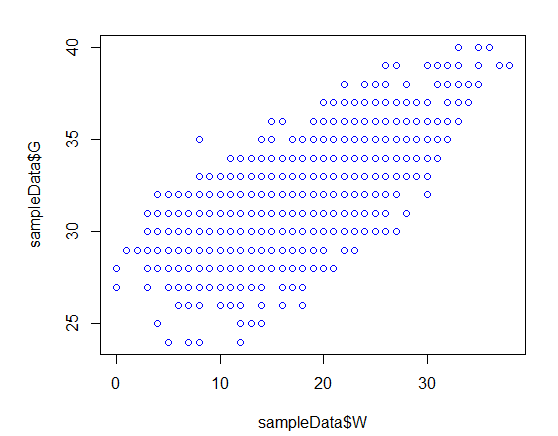
- In this example, we are creating a scatter diagram or scatter plot for G and W variables using
plot(sampleData$G~sampleData$W,col='blue')
- This scatter plot represents the graph for bivariate analysis
-
- Next, we will discuss the t-test, which is the statistical hypothesis testing process using R.
- t,test() function used in R to process the t-test
- We will use G variable data of data frame sample data for t-test
- test(sampleDat$G) is the syntax we will apply on the R Studio console.
- T-test shows the statistical inferences and the confidence interval .as outcomes.
- The p-value is the probability value significant to the null hypothesis. And the percentage value is the confidence interval.
- Next, we will discuss the t-test, which is the statistical hypothesis testing process using R.
t.test(sampleData$G)
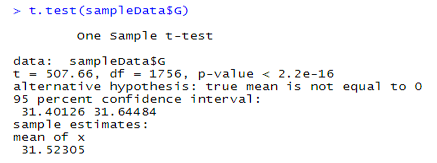
- In this T-test, the P-value is <2.2e-16, and the confidence interval is 95%. It also shows a mean value of 31.52205.
- This T-test shows the Alternate hypothesis is true in the hypothesis testing process.
Importance of Statistical Analysis with R language
- R is a reliable programming language for Statistical Analysis.
- It has a wide range of statistical library support like T-test, linear regression, logistic regression, and time-series data analysis.
- R comes with very good data visualization features supporting potting and graphs using graphical packages like ggplot2.
- It is a scripting language that helps statisticians and data scientists to develop code and test individual statistical models for efficient data analysis.
- The code written in R for statistical analysis is easy to interpret and sharable to other stack holders of the organization and coworkers.
- R language includes various built-in datasets for learning and creating a proof of concept before using actual business data for statistical analysis.
Conclusion
It is an integrated phase of data science projects. Due to its native support of statistical computation, and wide community support, it makes it unique from its competitors like Python language, SAS, IBM SPSS Statistics, MATLAB, Minitab, and Microsoft Excel. Statistical analysis using R is evolving with version upgrades.
Recommended Articles
This is a guide to Statistical Analysis with R. Here we discuss the introduction, How to Perform Statistical Analysis with R language? and Importance of Statistical Analysis with R language, respectively. You may also have a look at the following articles to learn more –
