Updated April 1, 2023
![Pandas DataFrame.loc[]](https://www.educba.com/academy/wp-content/uploads/2020/05/Pandas-DataFrame.loc_-1.jpg)
Introduction to Pandas DataFrame.loc[]
A dataframe being a data structure formulated by means of row , column format. There will be always the necessity to locate across some specific values, some specific rows, or even drilling up to locating the values at field level. In the panda’s library, these functionalities are achieved by means of the Pandas DataFrame.loc[] method. The locate method allows us to classifiably locate each and every row, column, and fields in the dataframe in a precise manner. It also provides the capability to set values to these located instances. In this topic, we are going to learn about Pandas DataFrame.loc[].
Syntax:
DataFrame.loc(locationvalue)Parameters:
| Parameter | Description |
| locationvalue | The location value is the value which is been attempted to locate, here the row_id or the combination of row_id with another row_id could be mentioned to locate specific data.
Ex : loc( row_id ) This returns the entire row which is mentioned.
|
Examples of Pandas DataFrame.loc[]
Here are the following examples mention below
Example #1
Code:
import pandas as pd
Core_Dataframe = pd.DataFrame({'Emp_No' : ['Emp1','Emp2','Emp3','Emp4'],
'Employee_Name' :  ['Arun', 'selva', 'rakesh', 'arjith'],
'Employee_dept' : ['CAD', 'CAD', 'DEV', 'CAD']})
print(" THE CORE DATAFRAME ")
print(Core_Dataframe)
print("")
print(" OUTPUTS FROM CORE DATADRAME LOCATE")
print("")
print(Core_Dataframe.loc[0])
print("")
print(Core_Dataframe.loc[2:3])
print("")
print(Core_Dataframe.loc[3])
Output:
![Pandas DataFrame.loc[] output 1](https://www.educba.com/academy/wp-content/uploads/2020/05/Pandas-DataFrame.loc-output-1.png)
Explanation: In this example the core dataframe is first formulated. pd.dataframe() is used for formulating the dataframe. Every row of the dataframe is inserted along with their column names. Once the dataframe is completely formulated it is printed on to the console.
We can notice at this instance the dataframe holds details like employee number, employee name and employee department. Over this dataframe the Pandas DataFrame.loc[] method is applied in three ways, in the first and third technique an entire row is located by specifying the index involved, in the second technique couple of rows are sliced by mentioning those index values in the loc().
Example #2
Code:
import pandas as pd
Core_Dataframe = pd.DataFrame({'A' :  [ 1, 6, 11, 15, 21, 26],
'B' :  [2, 7, 12, 17, 22, 27],
'C' :  [3, 8, 13, 18, 23, 28],
'D' :  [4, 9, 14, 19, 24, 29],
'E' :  [5, 10, 15, 20, 25, 30]})
print("")
Core_Dataframe.rename(index= { 0 : 'Row1',
1 : 'Row2',
2 : 'Row3',
3 : 'Row4',
4 : 'Row5',
5 : 'Row6'} , inplace =True)
print(" THE CORE DATAFRAME ")
print(Core_Dataframe)
print("")
print(" CORE DATAFRAME LOCATE ")
print(Core_Dataframe.loc[Core_Dataframe['A'] > 10])
Output:
![Pandas DataFrame.loc[] output 2](https://www.educba.com/academy/wp-content/uploads/2020/05/Pandas-DataFrame.loc-output-2.png)
Explanation: In this example the core dataframe is first formulated. pd.dataframe() is used for formulating the dataframe. Every row of the dataframe is inserted along with their column names. Once the dataframe is completely formulated it is printed on to the console. We can notice at this instance the dataframe holds a random set of numbers and alphabetic values of columns associated with it. Here the loc() method is used for locating all rows for which the first column named ‘A’ has a value greater than 10. So These rows alone get printed on to the console.
Example #3
Code:
import pandas as pd
Core_Dataframe = pd.DataFrame( {
'name': ['Alan Xavier', 'Annabella', 'Janawong', 'Yistien', 'Robin sheperd', 'Amala paul', 'Nori'],
'city': ['california', 'Toronto', 'ontario', 'Shanghai',
'Manchester', 'Cairo', 'Osaka'],
'age': [51, 38, 23, 64, 18, 31, 47],
'py-score': [82.0, 73.0, 81.0, 30.0, 48.0, 61.0, 84.0] })
Core_Dataframe.set_index('name',inplace=True)
print("THE CORE DATAFRAME ")
print(Core_Dataframe)
print("")
print("CORE DATAFRAME LOCATE AND ALTER VALUE")
for iter in Core_Dataframe.iterrows():
if (Core_Dataframe.loc[iter[0],'py-score' ]) > 65:
Core_Dataframe.loc[iter[0], 'py-score' ] = 'pass'
print(Core_Dataframe)
Output:
![Pandas DataFrame.loc[] output 3](https://www.educba.com/academy/wp-content/uploads/2020/05/Pandas-DataFrame.loc-output-3.png)
Explanation: In this example the core dataframe is first formulated. pd.dataframe() is used for formulating the dataframe. Every row of the dataframe is inserted along with their column names. Once the dataframe is completely formulated it is printed on to the console. We can notice at this instance the dataframe holds random people information and the py_score value of those people.
The key columns used in this dataframe are name, age, city, and py-score value. Here every row in the dataframe is iterated through a iterrows function and when the pyscore of the dataframe is greater than 65 then the user is considered as ‘pass’ and the same is updated in the py-score column. the dataframe after the update is printed on to the console.
Example #4
Code:
import pandas as pd
Core_Dataframe = pd.DataFrame({'Column1' :  [ 'A', 'B', 'C', 'D', 'E', 'F'],
'Column2' :  [ 'G', 'H', 'I', 'J', 'K', 'L'],
'Column3' :  [ 'M', 'N', 'O', 'P', 'Q', 'R'],
'Column4' :  [ 'S', 'T', 'U', 'V', 'W', 'X'],
'Column5' :  [ 'Y', 'Z', None, None, None, None]})
print("")
Core_Dataframe.rename(index= { 0 : 'Row1',
1 : 'Row2',
2 : 'Row3',
3 : 'Row4',
4 : 'Row5',
5 : 'Row6'} , inplace =True)
print("THE CORE DATAFRAME ")
print(Core_Dataframe)
print("")
print("CORE DATAFRAME LOCATE ")
print(Core_Dataframe.loc[ 'Row6': 'column5' ])
Output:
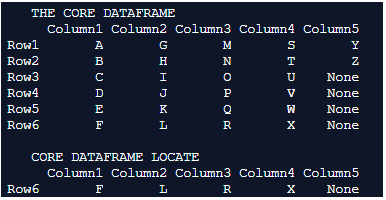
Explanation: In this example the core dataframe is first formulated. pd.dataframe() is used for formulating the dataframe. Every row of the dataframe is inserted along with their column names. Once the dataframe is completely formulated it is printed on to the console. We can notice in this example the dataframe is associated with the values of alphabets in the English dictionary.
Every column in the dictionary is tagged with suitable column names. Here the Row index and the column index is used to slice and locate one specific row from the dataframe mentioned. the identified row is printed on to the console.
Example #5
Code:
import pandas as pd
Core_Dataframe = pd.DataFrame({'A' :  [ 1.23, 6.66, 11.55, 15.44, 21.44, 26.4 ],
'B' :  [ 2.345, 745.5, 12.4, 17.34, 22.35, 27.44 ],
'C' :  [ 3.67, 8, 13.4, 18, 23, 28.44 ],
'D' :  [ 4.6788, 923.3, 14.5, 19, 24, 29.44 ],
'E' :  [ 5.3, 10.344, 15.556, 20.6775, 25.4455, 30.3 ]})
Core_Dataframe.rename(index= { 0 : 'Row1',
1 : 'Row2',
2 : 'Row3',
3 : 'Row4',
4 : 'Row5',
5 : 'Row6'} , inplace =True)
print(" THE CORE DATAFRAME ")
print(Core_Dataframe)
print("")
print(" CORE DATAFRAME LOCATE ONLY ONE COLUMN ")
print(Core_Dataframe.loc[ : , 'D' ])
print("")
print(" CORE DATAFRAME LOCATE ONLY ONE FIELD")
print(Core_Dataframe.loc[ 'Row1' , 'D' ])
Output:
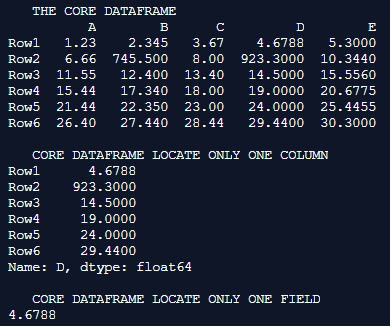
Explanation: In this example the core dataframe is first formulated. pd.dataframe() is used for formulating the dataframe. Every row of the dataframe is inserted along with their column names. Once the dataframe is completely formulated it is printed on to the console. A typical float dataset is used in this instance. Here this example displays how to locate only one specific column and even one specific field from the pandas dataframe.
Conclusion
The loc() is the most widely used function in pandas dataframe and the listed examples mention some of the most effective ways to use this function.
Recommended Articles
We hope that this EDUCBA information on “Pandas DataFrame.loc[]” was beneficial to you. You can view EDUCBA’s recommended articles for more information.

