Updated March 16, 2023

Introduction to Minitab Normality Test
In the Minitab statistical software, a tool normality test is easy to use. It is a statistical test in which the exact distribution is compared to the hypothetical normal distribution. A p-value less than the significance level (usually 0.05) shows that the data is not normal. The Anderson-Darling test determines if sample data is drawn from a group with a part of the distribution. The most common application is to see if the data follow the normal distribution: the mean and standard deviation of the data from the normal distribution, which is asymmetrical and uninterrupted.
Overview of Minitab Normality Test
The Normality Test examines whether or not data follow the normal distribution. A normal distribution is an asymmetrical bell-shaped arc around its mean. As close normality occurs spontaneously in many physical, biological, and social measuring circumstances, the normal distribution is the most commonly used statistical distribution. The normality test and probability plot were generally the best tools when determining normality. However, the normality test is a hypothesis test in disguise. The null hypothesis (Ho) states that the data is not out of the ordinary. And our alternative hypothesis (Ha) is that the data is out of the ordinary.
Choose one of the following methods to normalize the data:
- Then, align the data and transform the unit to standard deviations by subtracting and dividing by the number deviation.
- Subtract the mean and then center the data.
- Subtract the standard deviation: Standardize the scale for every variable we provide; then, we may compare them equally.
We have four options if the P-value is low enough to designate the deviations from the Gaussian notion of “statistically significant”:
- The information could come from a different identified distribution. If that’s the case, they might be able to turn the data into a Gaussian distribution.
- The normality test may fail due to one or a few outliers. Conduct an outlier analysis. Consider leaving out the outlier (s).
- If the deviation from normalcy is minor, they may decide to take no action. Statistical tests are often resistant to minor deviations from the Gaussian assumption.
As a statistically significant threshold, the p level p = 0.05, or a 1 in 20 probability of someone being exceeded by chance, is used. Currently, the success or failure of our intervention is determined by the “p” value, which is frequently referenced.
How to Run Minitab Normality Test?
Using Minitab to Run a Normality Test:
It’s critical to determine whether the data follows a normal distribution before proceeding with any data analysis. We can claim the data is regularly distributed if it is symmetrically dispersed and most outcomes are in the middle. Therefore, “Anderson-Darling” is the default choice for Tests for Normality in Minitab.
Formulate a hypothesis. Starting with the hypothesis is an excellent technique to approach any quantitative investigation. For example, the null hypothesis in a normality test is that the information follows a normal distribution, whereas the alternate hypothesis is that the data doesn’t follow a normal distribution.
To run an Anderson-Darling normality test in Minitab, go to Stat > Basic Statistics > Normality Test, pick the columns of data we want to analyze, then Anderson-Darling as the test technique, and press OK. In our product rate example, the p-value is 0.819, indicating that the data follows a normal distribution. By baseline, Anderson-Darling normality test results are displayed in the graphical summary and the probability plot. The workbook includes a normal probability graphic. If the information is from a normal curve, the numbers must fall on a pretty straight path.
Here is the sample data and will see how the test is executed: To evaluate if the data are regularly distributed, we’ll need more data points than this.
Here is where we’ll go over the steps:
Step 1: Initially, you must select raw data in the C1 column. In our case, the column name is Product Rate. This is because we are taking Different product rates for an analysis.
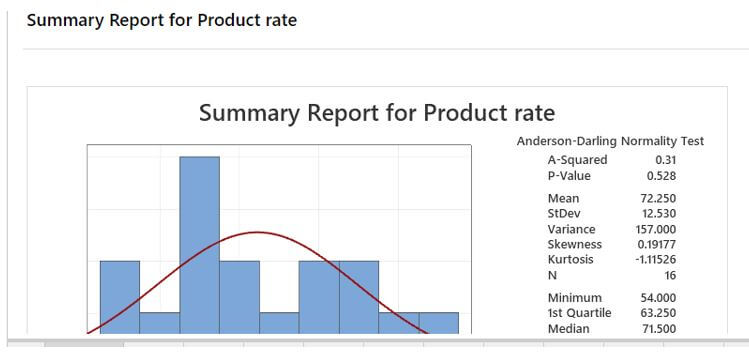
Step 2: Select Stat > Basic Statistics from the drop-down menu. Select “Product rate” as the factor and reveal the graphical summary.
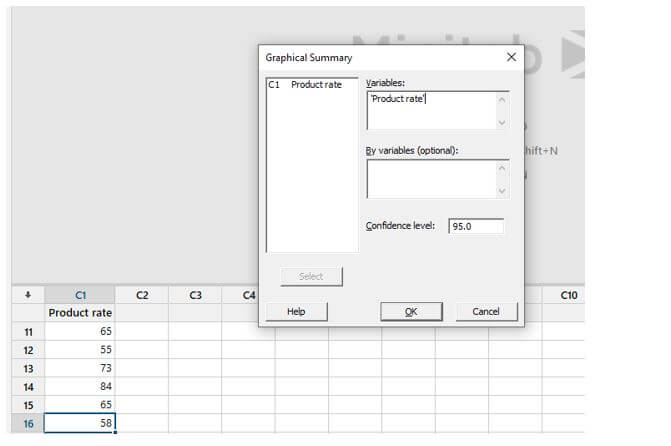
Step 3:
Example of Minitab Normality Test
Given below is an example of the Minitab Normality Test:
Consider the company that intended to conduct a study on the relationship between team performance and annual performance but intended to see if its 30 participants matched the average wage in terms of the research capacity, as indicated by their AWS score. The professor could evaluate the 30 individuals’ AWS scores to the national average using a one-sample t-test.
Sample data:
35,43,42,57,10,14,17,25,28,33,58,60,5518,17,24,38,50
Step 1: The first step is to choose a dataset to perform a normality test.
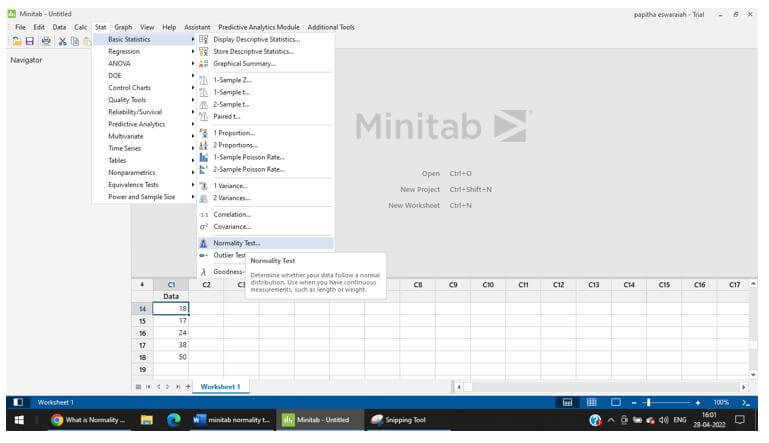
Step 2: Minitab spreadsheet shows the cells to enter data. Then hit “stat” in the menubar and select a sub-menu Normality test.
The snippet is shown here:
Step 3: Next shows a small window where we must select a variable name and Anderson- Darling under the normality test. Make sure we shout select a variable name under the “Variable tab.”
Step 4: The final plot is shown here, in which a probability plot is displayed.
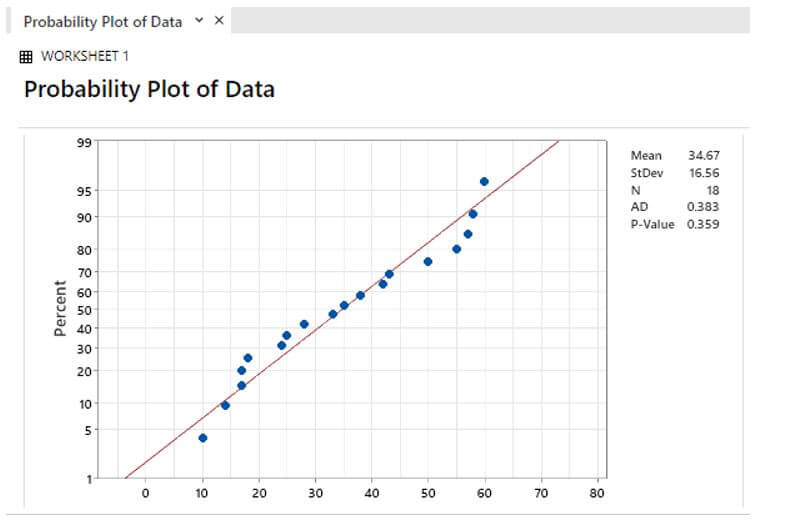
The p-value presented in the Normal Probability Plot should be understood. With just one screen, a normal probability plot will emerge. But, first, we must determine whether the p-value presented in the standard normal distribution is more than or less than 0.05. In our case, the p-value is less than 0.05.
Step 5: If the assumption is violated, the conclusion will be “Data doesn’t follow a normal distribution.” Let’s connect the p-value to the hypothesis in words. Considering the dependency on the performance of the two normality tests, we can expect a reasonable normal approximation.
Conclusion
The normality tests may not be able to identify minor deviations from the Gaussian ideal with smaller samples. Therefore, we used the tests on the normal curve in this article. The test entails calculating the Anderson-Darling statistic and then computing the statistic’s p-value. It’s frequently used in conjunction with the normal probability plot.
Recommended Articles
This is a guide to Minitab Normality Test. Here we discuss the introduction, overview, and how to run the Minitab normality test. You may also have a look at the following articles to learn more –
