Updated March 22, 2023
Definition of Mean Shift Algorithm
Mean Shift Algorithm is one of the clustering algorithms that is associated with the highest density points or mode value as the primary parameter for developing machine learning. It is a type of unsupervised machine learning algorithm. The algorithm works on the concept of Kernel Density Estimation known as KDE. It is also known as mode seeking algorithm. The Kernel is associated with mathematical computation related to weightage to the data points. There are mainly two popular kernel functions associated with the mean Shift Algorithm such as the flat kernel and Gaussian Kernel. This algorithm is mostly used for computer vision and image segmentation.
Mean Shift Algorithm Clustering
An unsupervised learning technique discovered by Fukunaga and Hostetler to find clusters:
- Mean Shift is also known as the mode-seeking algorithm that assigns the data points to the clusters in a way by shifting the data points towards the high-density region. The highest density of data points is termed as the model in the region. It has applications widely used in the field of computer vision and image segmentation.
- KDE is a method to estimate the distribution of the data points. It works by placing a kernel on each data point. The kernel in math term is a weighting function that will apply weights for individual data points. Adding all the individual kernel generates the probability.
The Kernel Function is required to satisfy the following conditions:
- The first requirement is to ensure the kernel density estimate is Normalized.
- The second requirement is that KDE is well associated with the symmetry of space.
Two Popular Kernel Functions
Below are the Two Popular Kernel Functions used in it are:
- Flat Kernel
- Gaussian Kernel
- Based on the Kernel param used the resultant density function varies. If no kernel parameter is mentioned, Gaussian Kernel is invoked by default. KDE utilizes the concept of probability density function which helps to find the local maxima of the data distribution. The algorithm works by making the data points to attract each other allowing the data points towards the area of high density.
- The data points which try to converge towards the local maxima will be of the same cluster group. In contrast to the K-Means clustering algorithm, the output of the Mean Shift algorithm does not depend on assumptions on the shape of the data point and the number of clusters. The number of clusters will be determined by the algorithm with respect to data.
- In order to perform the implementation of the algorithm, we make use of python package SKlearn.
Implementation of the Mean Shift Algorithm
Below is the implementation of the algorithm:
Example #1
Based on Sklearn Tutorial for Mean Shift Clustering Algorithm. The First snippet will implement a mean shift algorithm to find the clusters of the 2-Dimensional data set. Packages used to Implement the Mean shift Algorithm.
Code:
fromcluster importMeanShift, estimate_bandwidth

from sklearn.datasets.samples_generator import make_blobs as mb

importpyplot as plt

fromitertools import cycle as cy
One key thing to note is that we will be using sklearn’s make_blobs library to generate data points centered at 3 locations. In order to apply the Mean shift algorithm to the generated points, we must set the bandwidth which represents the interaction between the length. Sklearn’s Library has in-built functions to estimate the bandwidth.
Code:
#Sample data points
cen = [[1, .75], [-.75, -1], [1, -1]]
x_train, _ = mb(n_samples=10000, centers= cen, cluster_std=0.6)
# Bandwidth estimation using in-built function
est_bandwidth = estimate_bandwidth(x_train, quantile=.1,
n_samples=500)
mean_shift = MeanShift(bandwidth= est_bandwidth, bin_seeding=True)
fit(x_train)
ms_labels = mean_shift.labels_
c_centers = ms_labels.cluster_centers_
n_clusters_ = ms_labels.max()+1
# Plot result
figure(1)
clf()
colors = cy('bgrcmykbgrcmykbgrcmykbgrcmyk')
fori, each inzip(range(n_clusters_), colors):
my_members = labels == i
cluster_center = c_centers[k]
plot(x_train[my_members, 0], x_train[my_members, 1], each + '.')
plot(cluster_center[0], cluster_center[1],
'o', markerfacecolor=each,
markeredgecolor='k', markersize=14)
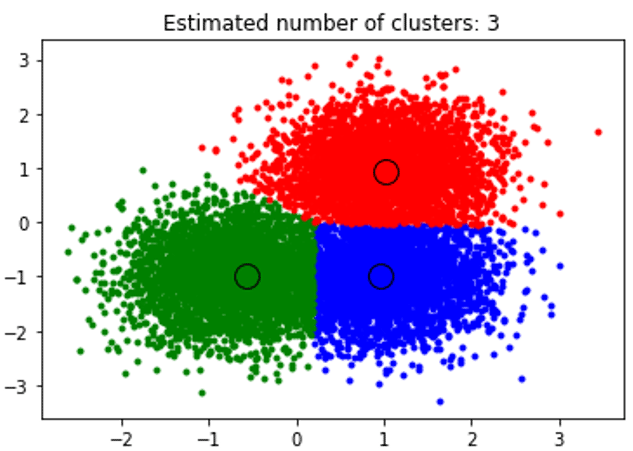
title('Estimated cluster numbers: %d'% n_clusters_)
show()
The above snippet performs clustering and the algorithm found clusters centered on each blob we generated. We can see that from the below image plotted by the snippet shows the Mean shift algorithm able to identify the number of clusters needed in run time and figure out the appropriate bandwidth to represent the interaction length.
Output:
Example #2
Based on Image Segmentation in Computer Vision. The Second snippet will explore how the Mean shift Algorithm used in Deep Learning to perform segmentation of the colored image. We are making use of the Mean Shift Algorithm to identify the spatial clusters. The earlier snippet we used 2-D data set whereas in this example will explore 3-D space. Pixel of the image will be treated as data points(r,g,b). We need to convert the image to array format so that it will each pixel represents data point in the image we going to the segment. Clustering the color values in space returns series of clusters, where the pixels in the cluster will be similar to RGB space. Packages used to Implement Mean Shift Algorithm:
Code:
importnumpy as np

fromcluster importMeanShift, estimate_bandwidth

fromdatasets.samples_generator importmake_blobs

importpyplot as plt

fromitertools import cycle

fromPIL import Image
Below Snippet to perform segmentation of the Original image:
#Segmentation of Color Image

img = Image.open('Sample.jpg')

img = np.array(img)

#Need to convert image into feature array based

flatten_img=np.reshape(img, [-1, 3])

#bandwidth estimation

est_bandwidth = estimate_bandwidth(flatten_img,

quantile=.2, n_samples=500)

mean_shift = MeanShift(est_bandwidth, bin_seeding=True)

fit(flatten_img)

labels= mean_shift.labels_

# Plot image vs segmented image

figure(2)

subplot(1, 1, 1)

imshow(img)

axis('off')

subplot(1, 1, 2)

imshow(np.reshape(labels, [854,1224]))

axis('off')
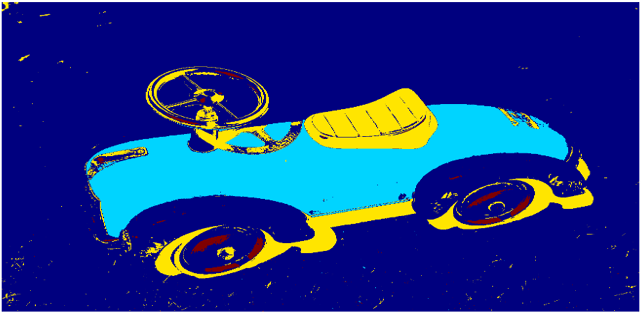
The generated image states that this approach to identify the shapes of images and determine the spatial clusters can be done effectively without any image processing.
Output:

Benefits and Applications of Mean Shift Algorithm
Below are the benefits and application of the mean algorithm:
- It is widely used to solve computer vision, where it is used for image segmentation.
- Clustering of data points in real-time without mentioning the number of clusters.
- Performs well on image segmentation and Video tracking.
- More Robust to Outliers.
Pros of Mean Shift Algorithm
Below are the pros mean shift algorithm:
- The output of the algorithm is independent of initializations.
- The procedure is effective as it has only one parameter – Bandwidth.
- No Assumptions on the number of data clusters and the shape.
- It has better performance than K-Means Clustering.
Cons of Mean Shift Algorithm
Below are the cons of the mean shift algorithm:
- Expensive for large features.
- Compared to K-Means clustering it is very slow.
- Algorithm output depends on the parameter bandwidth.
- Output depends on the size of the window.
Conclusion
Although it is a straightforward approach which primarily used to solve problems related to image segmentation, clustering. It is comparatively slower than K-Means and it is computationally expensive.
Recommended Articles
This is a guide to the Mean Shift Algorithm. Here we discuss problems related to image segmentation, clustering, benefits, and two Kernel Function. You can also go through our other related articles to learn more-
