Updated July 10, 2023

Introduction to Matlab xticks
The ‘xticks function’ is used in Matlab to assign tick values & labels to the x-axis of a graph or plot. By default, Matlab’s plot function (used to draw any plot) creates ticks as per the default scale, but we might need to have ticks based on our requirements. Adding ticks per our need and labelling them make the plots more intuitive and easier to understand. For this, we can use the xticks function along with the xticklabels function in Matlab to easily identify the values of our choice on the plots.
Syntax of xticks function:
xticks (A)xticks (A : B : C)Explanation:
- You use xticks(A) to set the ticks defined by the vector A. Please note that A must have values in ascending order.
- You use xticks(A: B: C) to set the ticks defined by the range A to C with a gap of B between the ticks.
Examples of Matlab xticks
Given below are the examples of Matlab xticks:
Example #1
In this example, we will use the plot function to plot a sine wave and then set the ticks for it using the xticks function.
Below are the steps to be followed:
- Write the code to create a sine wave.
- Use the xticks function to set the ticks for the x-axis.
- Use the xticklabels function to set the labels for the ticks defined in the above step.
Code:
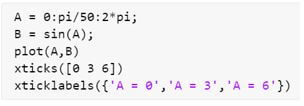
A = 0 : pi/50 : 2*pi;
[Initializing the range for sine wave]
B = sin (A);
[Initializing the sine wave]
plot (A, B)
[Using the plot function to plot the sine wave]
xticks ([0 3 6])
[Using the xticks function to set the ticks for the x-axis]
xticklabels ({‘A = 0′,’A = 3′,’A = 6’})
[Using the xticklabels function to set the labels for the ticks]
Input:
Output:
As we can see in the output, we have obtained ticks of our choice, i.e., 0, 3, 6, using the xticks function. We have also set the labels for these ticks using the xticklabels function.
Example #2
In this example, we will use the plot function to plot a cos wave and then set the ticks for it using the xticks function.
Below are the steps to be followed:
- Write the code to create a cos wave.
- Use the xticks function to set the ticks for the x-axis.
- Use the xticklabels function to set the labels for the ticks defined in the above step.
Code:
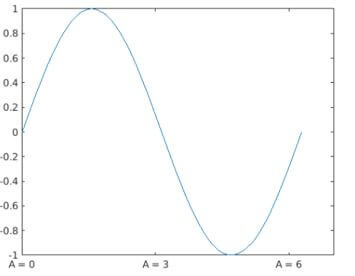
A = 0 : pi/100 : 3*pi;
[Initializing the range for cos wave]
B = cos (A);
[Initializing the cos wave]
plot (A, B)
[Using the plot function to plot the cos wave]
xticks ([0 3 6 9])
[Using the xticks function to set the ticks for the x-axis]
xticklabels ({‘A = 0′,’A = 3′,’A = 6’, ‘A = 9’})
[Using the xticklabels function to set the labels for the ticks]
Input:
Output:
As we can see in the output, we have obtained ticks of our choice, i.e., 0, 3, 6, 9, using the xticks function. We have also set the labels for these ticks using the xticklabels function.
In the above 2 examples, we have passed all the values we want to set as plot ticks as arguments to the xticks function.
Next, we will see how to set a range of values with a fixed interval as the ticks of a plot.
Example #3
In this example, we will use the plot function to plot a sine wave and then will set the ticks for it by passing a range as an argument to the xticks function.
Below are the steps to be followed:
- Write the code to create a sine wave.
- Use the xticks function to set the ticks for the x-axis.
- Use the xticklabels function to set the labels for the ticks defined in the above step.
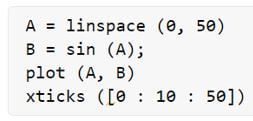
Code:
A = linspace (0, 50)
[Initializing the range for sine wave]
B = sin (A);
[Initializing the sine wave]
plot (A, B)
[Using the plot function to plot the sine wave]
xticks ([0 : 10 : 50])
[Using the xticks function to set the ticks for the x-axis]
Input:
Output:
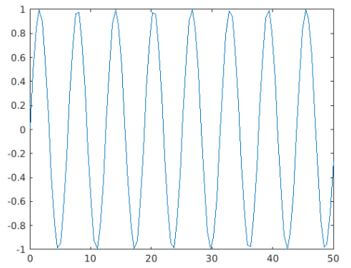
As we can see in the output, we have obtained ticks of our choice by passing a range as an argument to the xticks function.
Conclusion
The xticks function is used in Matlab to assign tick values to the x-axis. The xticklabels function can be used along with the xticks function to label the ticks assigned. A range and a set of values can be passed as an argument to the xticks function.
Recommended Articles
We hope that this EDUCBA information on “Matlab xticks” was beneficial to you. You can view EDUCBA’s recommended articles for more information.
