Updated May 29, 2023

Introduction to Matlab two yyaxis
Matlab provides a different kind of functionality to the user; the two yyaxis is the one functionality that is provided by Matlab. By using the two yyaxis, we can create the axes on both sides, that is, the left side and right side. Basically in yyaxis left axes are activating from the current associated with the left side axes, at the same time some graphics commands choose the left side. When the current axis does not include the two yyaxis at that time, graphics commands add the required yyaxis, that is y-axis, to the yyaxis. By using two y-axes, we can draw the graph as per our requirement.
Syntax
There are multiple syntaxes available for two yyaxis as follows.
yyaxis left activate side

yyaxis left activate side

yyaxis (axis, specified activate side)
Explanation
In the first syntax, we define the left activate side of axes and that associated with the left yyaxis. When we define this syntax, at the same graphics commands, select the left side. If there are no axes, then the graphics command adds a second y-axis.
In the second syntax, we define the right activated side of axes and that associated with the right yyaxis. When we define this syntax, at the same graphics commands, select the right side. If there are no axes, then the graphics command added a second yyaxis
In the third syntax, we can define the specified activated side of axes instead of the current axes. Similarly, there are no axes; then the graphics command added two y-axes.
How did yyaxis work in Matlab?
Now let’s see how the yyaxis works in Matlab as follows.
There are different ways to draw the graph, as follows.
- Draw a graph by using two yyaxis:
In this method, we need to use the yyaxis on the left and right sides. We start the plotting graph from the left side to the right activated side. After that graphics command, select the activated right side against the provided data and specify the limit for the right y-axis.
- Now let’s see how we can add titles and labels on each side:
In this method, we can add titles and labels for charts by using y-axes. To add titles and labels we need to use hwtdata () and label () commands as per our requirement.
- Multiple sets on each data side:
In this method, we can plot the two different lines against records of the left yyaxis by using the hold-on command as per requirement.
- Now let’s see how we can add the colors to the chart:
We can add color combinations by using the color order () function. In this method, we can specify the color of each side of the axes; here, we can set the two different colors as per our requirement, and after that, we can plot the two lines against the left side and right side yyaxis.
- Now let’s see how we can control the plot colors:
By using this method, we can plot the bar chart as per our requirement, and we can use different color combinations for each bar by using colororder () function.
Now let’s see what the input argument is and how it is helpful to the yyaxis as follows.
Basically, we use two input arguments to plot the chart, such as target axes. Normally target axes are used to specify the axes object. If we miss specifying the object, then the yyaxis uses the current axes.
Yyaxis uses grid lines, color, and Line styles algorithm to plot the required chart or bar as per our requirement.
Examples
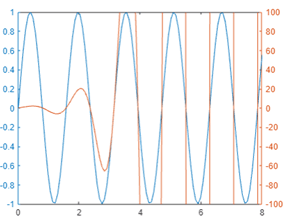
Now let’s see the different examples of the yyaxis in Matlab for better understanding as follows. Now let’s see how we can plot records by using two y-axes as follows.
a = linspace(0,8);

b = sin(4*a);

yyaxis left

plot(a,b)

c = sin(4*a).*exp(1.5*a);

yyaxis right

plot(a,c)

ylim([-100 100])
Explanation
By using the above example, we plot the records by using two y-axes. Here we use the linspace() function as well as sin, as shown in the above example. At the end of the example, we set the limit for right side axes. The final output of the above statement we illustrated by using the screenshot, is as follows.
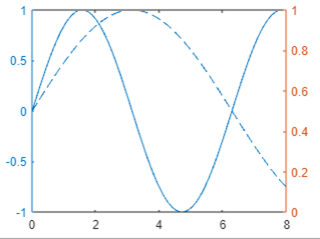
Now let’s see how we can plot a chart with multiple sets for each side as follows.
a = linspace(0,8);

yl1 = sin(a);

yl2 = sin(a/2);

yyaxis left

plot(a,yl1)

hold on

plot(a,yl2)
Explanation
In the above example, we use the hold-on command to plot the two lines against the left axes as shown in the above example. The final output of the above statement we illustrated by using the screenshot as follows.
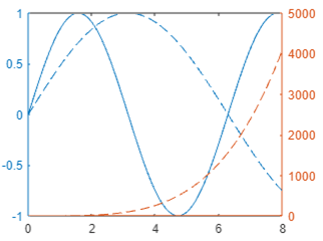
Similarly, we can plot two lines by using right side axes as follows.
a = linspace(0,8);

yr1 = a;

yr2 = a.^4;

yyaxis right

plot(a,yr1)

plot(a,yr2)

hold off
Explanation
In the above example, we use the linspace () function to plot the chart. See here when we plot right, we need to use some different parameters as compared to the left yyaxis. Here we use yr1 instead of yl1 and hold off instead of holding on, as shown in the above example. After that, we also need to change the direction, which means left to right yyaxis, as shown. The final output of the above statement we illustrated by using the screenshot, is as follows.
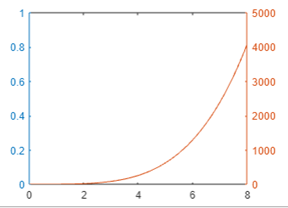
Suppose we need to activate the left side at that time; we can use the following statement as follows.
yyaxis left

cla
Explanation
The final output of the above statement we illustrated by using the screenshot, is as follows.
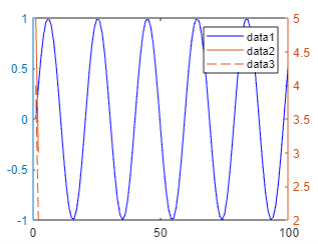
Now let’s see the example of a color chart that means we can add the color as follows.
colororder({'b','m'})

yyaxis left

a = [2 3; 4 5];

plot(y)

yyaxis right

b = [5 4; 3 2];

plot(b)

legend
Explanation
In the above example, we use the color order () command. The final output of the above statement we illustrated by using the screenshot, is as follows.
So in this way, we can plot any type of chart or bar as per our requirement with different color combinations.
Conclusion
We hope from this article; you learn the Matlab Y axis. From the above article, we have learned the basic syntax of the yyaxis, and we also see different examples of the yyaxis. From this article, we learned how and when we use Matlab y-axis.
Recommended Articles
This is a guide to the Matlab yyaxis. Here we discuss the basic syntax of the yyaxis, and we also see different examples of the yyaxis. You may also have a look at the following articles to learn more –
