Updated June 7, 2023

Introduction of Matlab Saveas
In some applications, there is a need to save the output figure file to do further operations like data reading and data analysis from an output file to reference the output figure file. To save a figure to a specific file, we use a saveas statement. SAVEAS is an inbuilt function available on matlab for save the figure to specific file format. We can save the figures in different formats like png, jpg, epsc, etc.
Syntax:
The syntax for Matlab saveas functions as shown below:-
saveas(fig,filename)saveas(fig,filename,formattype)How to Do Matlab Saveas?
The saveas function saves an image with a specific file format, formats like .png, .jpg, and many more. So for this function, we have syntax, as we saw above. For using a saveas function, first, we want to create an image; for creating an image, we use a bar function, the bar is an inbuilt function available on matlab, and the bar graph makes using the bar(x1) function with one bar for each element in x1. If x1 is a y-by-z matrix, then the bar creates y groups of z bars. Or we can create an image using a plot function; the plot is also an inbuilt function available on matlab. The plot is used to draw a continuous line and figure like an analog signal. Then this figure is saved using a saveas function. For saving this created image, we take saveas in parenthesis gcf; then we take a file name with a figure extension. Let us assume we take ‘Barchart11’ as a name with the extension .png, and we also specify the format type in the ‘formattype’ argument.
Examples of Matlab Saveas
Following are the examples are given below:
Example #1
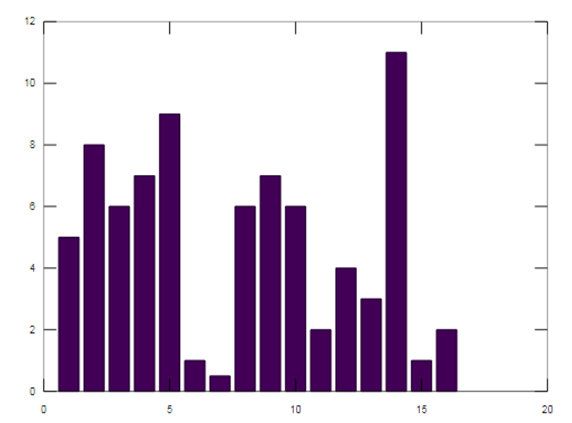
Let us see an example for a saveas statement; the saveas function is an inbuilt function available on a matlab; it is used to save figures to a specific format. In this example, we create a bar chart; for creating a bar chart, we take data in variable x1. We take a bar chart data in a square bracket, a space separates each data number, and these data are assigned to a variable x1. Then we use a bar function available on matlab, an inbuilt matlab function. The bar graph creates using the bar(x1) function with one bar for each element in x1. If x1 is a y-by-z matrix, then the bar creates y groups of z bars. Then this generated bar graph is saving in .png format using a saveas function. We take saveas function in the parenthesis, gcf, then a file name with a figure extension. In this example, we take ‘Barchart11’ as a name with the extension .png. We save a figure in .png format.
Code:
clc ;
clear all;
close all;
x1 = [5 8 6 7 9 1 0.5 6 7 6 2 4 3 11 1 2];
bar(x1);
saveas (gcf,'Barchart11.png')
Output:
Example #2
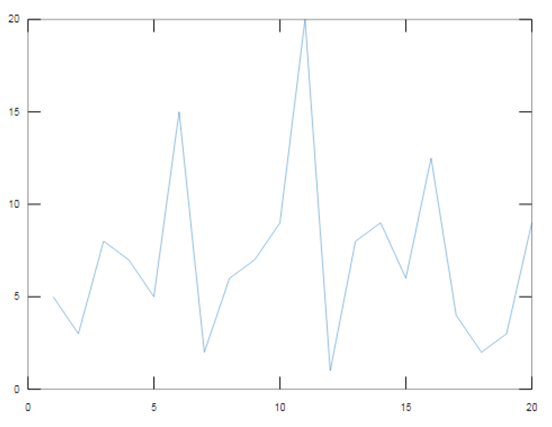
Let us consider an example for the saveas function; we create a figure in this example. For creating a figure, we use a plot; the plot is an inbuilt function available on matlab for creating a continuous signal of provided data. We take two variables, x, and y, for plotting data. In the x variable, we specify a range of 1 to 20 with a difference of 1. In the y variable, we take data that we plot on the x-axis. Then we use a plot(x, y) to generate a figure we want to save using a saveas function. We save this figure as an EPS file and use the epsc command to save it in color format. In the parenthesis, we take gcf. To save a current figure, we must specify fig as gcf, then take a file name, ‘Barchart1’, and specify the format type ‘formattype’ to epsc. In the EPS file, we save a figure.
Code:
clc;
clear all;
close all;
x = 1:1:20;y = [5 3 8 7 5 15 2 6 7 9 20 1 8 9 6 12.5 4 2 3 9];plot (x,y);
saveas (gcf, 'Barchart1', 'epsc')
Output:
Example #3
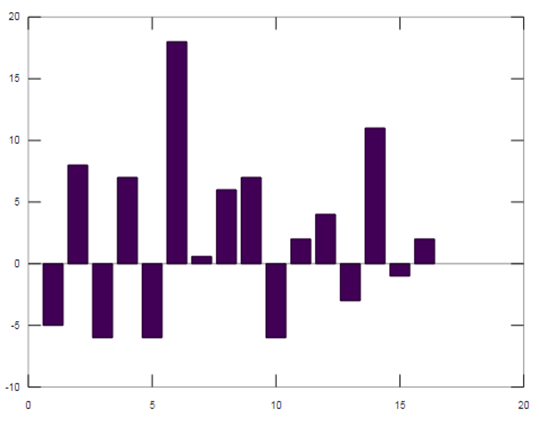
Let us see another example of a saveas statement; in this, we create a bar chart, and we take data in variable y1 for a bar chart. Now we can take the data’s positive and negative integer values and plot the bar graph. We use the bar function to plot the bar graph, which is available on Matlab. Then the generated bar is save in jpg format using saveas statement. We save a figure in the jpg file.
Code:
clc;
clear all;
close all;
y1 = [-5 8 -6 7 -6 18 0.59 6.0 7 -6 2 4 -3 11 -1 2];
bar (y1);
saveas (gcf, 'Bargraph.jpg')
Output:
Conclusion
In this article, we saw the concept of saveas matlab function; saveas is used to save figures to specific file formats. Then saw syntax related to saveas statements and how it is used in matlab code. Also, we saw some examples related to saveas statement and its output on matlab.
Recommended Articles
We hope that this EDUCBA information on “Matlab Saveas” was beneficial to you. You can view EDUCBA’s recommended articles for more information.
