Updated July 4, 2023

Introduction to MATLAB Text
The MATLAB function text() is designed to add descriptive text to data points on a plot. When adding text to a single data point, you provide scalar values for the x and y coordinates. On the other hand, when adding text to multiple points, you specify x and y as vectors of equal length. Different attributes from text() function also enable MATLAB to execute different special formats, such as displaying superscripts, subscripts, and display of special characters.
Syntax of MATLAB Text
Syntax of matlab text() is given below:
|
Syntax |
Description |
| text(x,y,txt) | This form can be used to add text content, specified as ‘txt’, to one or more than one data point (x,y)in the current axes. |
| text(x,y,z,txt) | This form can be used to add text content, specified as txt, to one or more number of 3-dimensional data points(x,y,z) in the current axes. |
| text(___,Name,Value) | This form can be used to specify any of the Text object properties in the form of name-value pairs to edit the presentation of the text. |
| text(ax,___) | This form can be used to create the text in the geographic, Cartesian, or polar axes, which are set as new axes being specified as‘ax’ instead of in the current axes i.e. gca. |
| t = text(___) | This form can be used to return the text content of the plot, storing it in one or more text objects. This text object can be used to modify properties of the text objects to change the appearance of the text, even after they are created. |
Examples of MATLAB Text
Following are the examples are given below:
Example #1
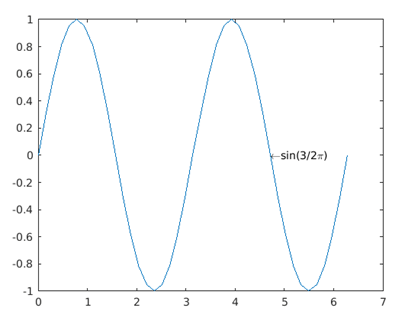
The below code snippet is written to place a single line of text at one single data point.
Code:
x = 0:pi/20:2*pi;

y = sin(2*x);

str=strcat("\leftarrow","sin(","3/2","\pi)");

plot(x,y)

text(3/2*pi,0,str)
Output:
The resultant plot has the configured text ‘sin(3/2π)’ at (3/2π,0) preceded by a leftward arrow.
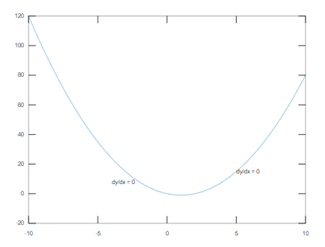
Example #2 – Configuring Same Text at Multiple Data Point
MATLAB supports the feature to configure text objects at multiple data points in a plot with a single command.
The below code places the text defined with the variable ‘txt’ at data points given by the vectors ‘xt’ and ‘yt.’
Code:
x = linspace(-10,10);

y = x.^2-2*x;

plot(x,y)

xt = [-4 5];

yt = [8 15];

txt = 'dy/dx = 0';

text(xt,yt,txt)
Output:
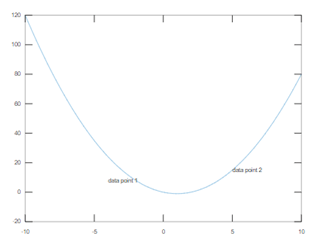
Example #3 – Placing Different Text for Different Data Point
The below code places different text objects defined by the vector ‘txt’ in a different set of data points given by the vectors ‘xt’ and ‘yt’.
Code:
x = linspace(-10,10);

y = x.^2-2*x;

plot(x,y)

xt = [-4 5];

yt = [8 15];

txt = {'data point 1','data point 2'};

text(xt,yt,txt)
Output:
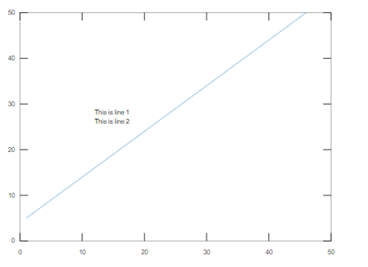
Example #4 – Multiline Text at Single Data Point
The code is written to place 2 text objects defined by the vector ‘str’ at one data point (12,27).
Code:
plot(5:50)

str = {'This is line 1','This is line 2'};

text(12,27,str)
Output:
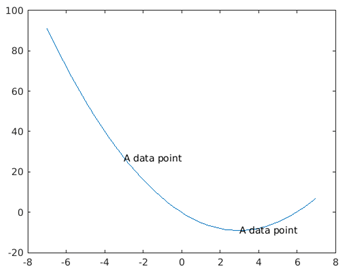
Example #5 – Using of Text Object to Store the Text Content
MATLAB supports editing the display of the text content after the text content is being created by having the feature to store the created text content in a text object.
Phase 1:
x = linspace(-7,7);

y = x.^2-6*x;

plot(x,y)

t = text([-3 3],[27 -9],'A data point')
Output:
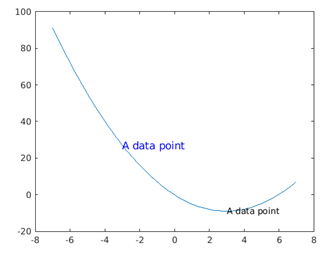
Phase 2:
t(1).Color = 'blue';

t(1).FontSize = 12;
Output:
Attributes
The text object in MATLAB includes various types of attributes which contribute to the customization of the appearance of the text on the plot, such as:
| Attribute | Description | Default value |
| FontSize | A non-zero scalar value that decides the size of the font of the displayed text | Depends on OS and locale |
| FontWeight | A string that decides the thickness of the characters in the displayed text | Normal |
| FontName | A string that decides the font style of the displayed text | FixedWidth |
| Color | A string that decides the color of the displayed text | [0,0,0] |
| HorizontalAlignment | A string that decides the horizontal alignment of the text with reference to the ‘position’ property x value. | left |
| Position | It decides the location of the text, being specified as a two-element vector of the form [x y] or a three-element vector of the form [x y z] | [0,0,0] |
| Units | It refers to position units, being specified as one of the values supported by MATLAB. | data |
| Interpreter | This attribute decides to apply markup to add subscript, superscript, or special display options.
Text interpreter, specified as one of these values:
|
tex |
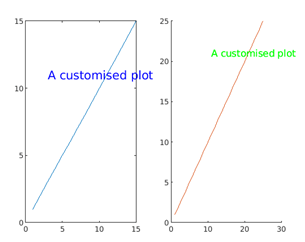
Example #6
The below example refers to generating 2 plots having text content at two different data points and the customization on the appearance of the texts being applied by altering the values for the attributes Color and FontSize.
C0de:
subplot(1,2,1)

plot(1:15)

text(3,11,'A customised plot','Color','blue','FontSize',15)

subplot(1,2,2)

hold on

plot(1:25)

text(11,21,'A customised plot','Color','green','FontSize',12)
Output:
Additional Note:
- LaTeX is a high-quality typesetting system; which includes features that are designed for the production of scientific and technical documentation. In order to change the font style, LaTeX markup must be used. The maximum character length supported byLaTeX interpreter is 1200 characters.
- The Clipping property for text objects always remains set to ‘off’ value, and the text seems to be appeared outside the axes by default.
Recommended Articles
This is a guide to MATLAB Text. Here we also discuss the introduction and syntax of matlab text() along with different examples and its code implementation. You may also have a look at the following articles to learn more –
