Updated March 13, 2023
Introduction to Matlab Surfc
Plots are the way of explaining the results graphically to the uninformed audience that doesn’t have any background knowledge about a particular topic. They are very helpful in explaining the outcome to the people who don’t have any prior knowledge in the technical front. There are multiple plots in Matlab which are used for various business purposes. Contour plots are the type of plots that are helpful in drawing the three-dimensional figures with the help of predictor variables (X and Y plane). Contour plots are also known as level plots. In this topic, we are going to learn about Matlab Surfc.
Working of surfc function in Matlab with Syntax
In Matlab, contour plots are used to plot the three-dimensional figures in the Z plane (response variable) with the help of predictor variables (X and Y). The three-dimensional figures that are plotted are known as contours. If we want to plot a contour plot under a surface plot, then we use surfc function in Matlab. Please find the below syntaxes which are used to plot the same:
- surfc (a, b, c): This is used to plot a surface plot that is three-dimensional in nature and a contour plot underneath of it. The surface plot is a three-dimensional plot that has a surface that consists of edges and different face colors. The values in matrix c are plotted as heights that are above the grid in the x-y plane, whose values are given by the variables a and b.
- surfc (a, b, c, color): This is used to draw the plot with the given surface color.
- surfc(c): This is used to plot a surface and contour plot with the values specified as the row and column elements in c as the (x, y) coordinates.
- surfc (axes value, ___): This will produce a plot with the axes value as specified, without working with the current axes value.
- surfc (___, Name of the property, value of the property): This syntax is used when we want to use any property of the plot and make the necessary customizations to the plot. We can assign the name of the property and the value to it according to the business requirements.
Examples of Matlab Surfc
Please find the below examples depicting the use of surfc function in Matlab:
Example #1
To display the contour plot under the surface plot with the help of matrices.
[a,b] = meshgrid(1:0.4:5,1:10);

c = cos(a) + sin(b);

surfc(a,b,c)
Output:
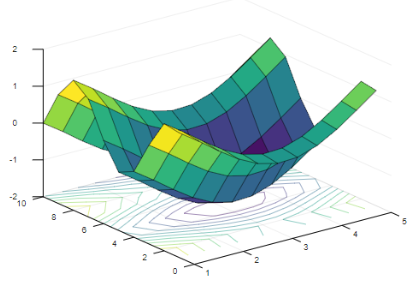
In the above example, the matrices are given as input and the contour plot is plotted under the surface plot. The surface of the respective plot takes the values of the function for its color and height.
Example #2
To show the use of the color map while plotting the contour plot under the surface plot:
[a,b] = meshgrid(-2:.115:2);

c = peaks(a,b);

d = a.*b;

surfc(a,b,c,d)

colorbar
Output:
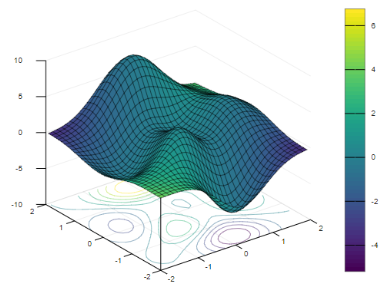
In the above example, we have assigned a new variable ‘d’ to use the colors in the surface and contour plot. The surface plot is plotted using the height values which is given by variable ‘c’. After using colormap, it should be noted that the size of c and d are the same. In the last part, we have added a colorbar to the plot to show how the values of colormap and values in variable ’d’ correspond to one another.
The first and the second input values i.e. ‘a’ and ‘b’ as used in the above syntax are the x and y coordinates which can be represented in the form of matrix or vector. If the values are represented in the form of a matrix, then it should be increasing or decreasing in one dimension and should remain constant in the other dimension. The function that is used to create the matrices for the input values can be achieved by using meshgrid function. If the values are represented in the form of a vector, then the values should increase or decrease. The third input value ‘c’ represents the height of the surface plot drawn at each x-y coordinate value. There should be at least two rows and two columns in it and is represented in the form of a matrix.
There are various properties of the plot that can be executed by the name and value of the property. Please find some of the below properties that can be used to customize the plots:
- We can change the edge color of the plot using different values like flat, interp, or any RGB triplet value. If the value is given as ‘flat’ then there should be different colors for each edge which can be defined by the CData property. If the value is given as ‘interp’ then there should be interpolated colors for each edge which can be defined by the CData property. We can also assign the RGB value to the edges. RGB values determine the intensity level of Red, Green, and Blue.
- We can also change the line style like solid, dashed, dotted or dash-dotted line, the dashed line being the default line style. The face color of the surface can also be changed with values like flat, interp, or any RGB value. If the value is given as ‘flat’ then there should be different colors for each surface which can be defined by the CData property. If the value is given as ‘interp’ then there should be interpolated colors for each surface which can be defined by the CData property. We can also assign the RGB value to the surfaces. RGB values determine the intensity level of Red, Green, and Blue.
- We can also change the transparency level of each face which can be in a particular range from 0 to 1, flat, interp, or texturemap.
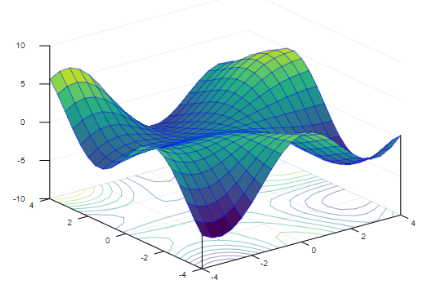
Example #3
To plot the edge color of the plot to blue:
[a,b] = meshgrid(-4:.4:4);

c = a.*sin(b) - b.*cos(a);

s = surfc(a,b,c,'EdgeColor','b');
Output:
Conclusion
Contour plots can be used to find the geographical locations in maps, to determine the storage capacity and various levels with respect to the ground and water. They have various other properties which can be customized depending on the requirements.
Recommended Articles
This is a guide to Matlab Surfc. Here we discuss the examples depicting the use of surfc function in Matlab along with the Working and syntax. You may also have a look at the following articles to learn more –
