Updated March 27, 2023

Introduction to 2D Plots in Matlab
2D Plots in Matlab is a feature that enables a user to create the two-dimensional graph for any dependent variable as a function of a depending variable. A plot can present the data in continuous, discrete, surface or volume form. The default standard function for 2D graph plotting is plot() function. It creates a line plot for data ‘Y’ with respect to its corresponding data in the ‘X’ axis.
For Example:
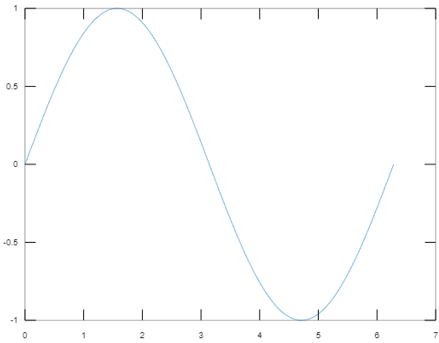
Let’s create 2D line plot for y=sin(x) where x ranges from 0 to 2*pi:
x=0:pi/100:2*pi

y=sin(x)

plot(x,y)
Output:
Attributes in 2D Plots in Matlab
MATLAB supports customizing the appearance and detailing of any graph. Users can customize the graph by editing the following attributes for any 2D plot function.
1. xlabel: Generates labels along the x-axis.
2. Ylabel: Generates label along the y-axis.
3. Title: Add a title to the graph
4. Grid on: Enables the grid lines for the graph
5. Axis equal: Enable user to create the plot with the same scale factor and spaces for both the axis
6. Axis square: Used to generate a square plot
Let’s consider the below example where the presentation of the graph is customized by modifying the attributes discussed above:
x=0:pi/100:2*pi;

y=sin(x);

%Create the graph with labeling x axis as ‘x-axis’, ‘y’ axis as ‘y-axis’

%with title 'Graph customization' and makes the grid for both the axis

%visible

plot(x, y), xlabel('x-axis'), ylabel('y-axis'), title('Graph

customisation'),

grid on
Output:

7. Axis Scaling: Axis scaling is configuring limit values for axis. The command ‘axis’ is used to set minimum and maximum limits for the graph.
Syntax:
axis ( [xmin xmax ymin ymax] )
Example:
Case #1
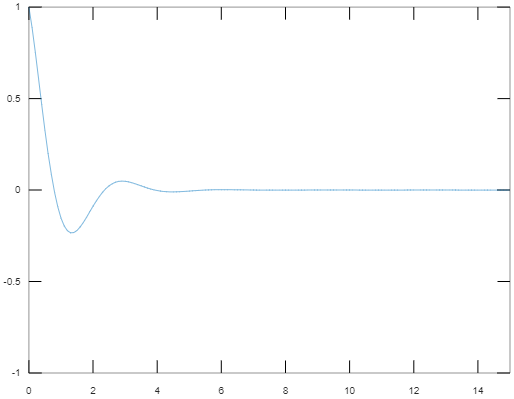
- %The maximum value of x-axis is set to 15
- %The minimum value of x-axis is set to 0
- %The minimum value of y-axis is set to -1
- %The maximum value of y-axis is set to 1
x = [0 : 0.1: 20];

y = exp(-x).*cos(2*x);

plot(x, y), axis([0 15 -1 1])
Output:
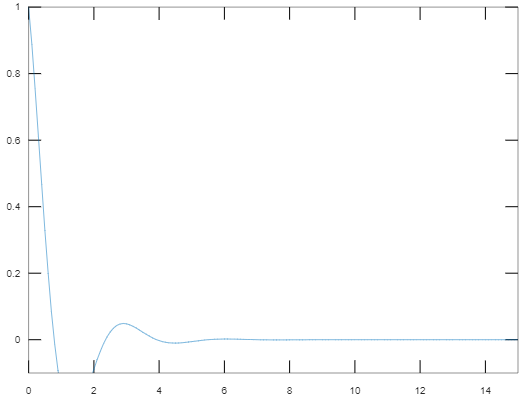
Case #2
- %The minimum value of y-axis is changed to -0.1
x = [0 : 0.1: 20];

y = exp(-x).*cos(2*x);

plot(x, y), axis([0 15 -0.1 1])
Output:
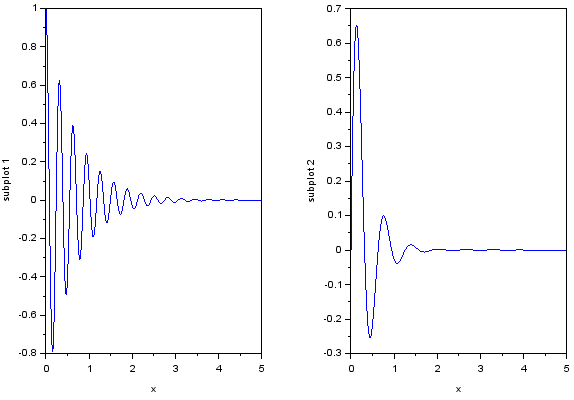
8. 2D plot using subplot: The function subplot provides the feature to generate an array of plots in the same figure, being placed as specified or default coordinates.
Code: The code is written to represent 2 functions in one single window
x = [0:0.01:5];

y = exp(-1.5*x).*cos(20*x);

% The first plot will be places first place where the complete figure space is divided into 2 parts as 1 row and 2 columns

subplot(1,2,1)

plot(x,y), xlabel('x'),ylabel('subplot 1'),axis([0 5 -1 1])

y = exp(-3*x).*sin(10*x);

% The first plot will be places first place where the complete figure space is divided into 2 parts as 1 row and 2 columns

subplot(1,2,2)

plot(x,y),xlabel('x'),ylabel('subplot 2'),axis([0 5 -1 1])
Output:
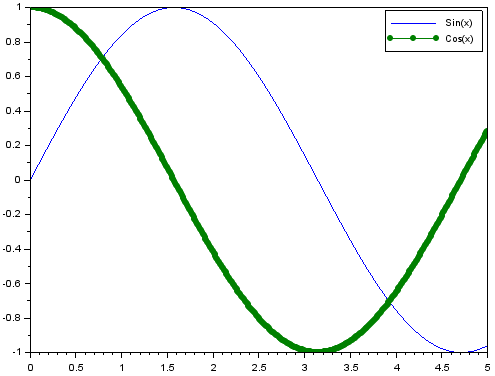
9. Presenting multiple functions on the same graph:
MATLAB has extended features to plot multiple functions within one single graph.
Code: The code is written to represent the functions y1 and y2 in one single graph
x = [0 :pi/10: 10];

y1 = sin(x);

y2 = cos(x);

plot(x, y1, x, y2, '.-'), legend('Sin(x)', 'Cos(x)')
Output:
Types of 2-D Graph Plots in MATLAB
MATLAB supports various types of 2-D graph plotting based on the type of representation that a user chooses. Out of various types of plotting functions, here major functions are discussed which are widely used in the industry.
1. Bar Plot
This is used to distribute the ‘y’ values along the x-axis in the form of bars. Usually, this is useful to represent the results over a period of time.
Code:
Y = [15,22,10     18,27,38     39,38,63     15,25,35     45,63,20];

figure

bar(Y)
Output:
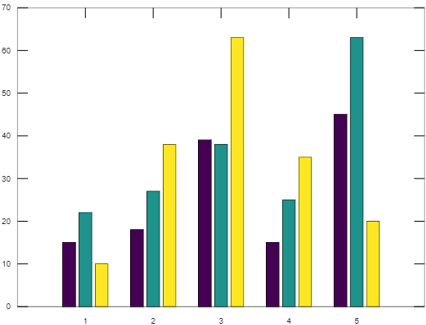
Elements get grouped together based on the row index. The x-axis values are created with respect to the row index for the ‘y’ matrix whereas the ‘y’ axis represents the values.
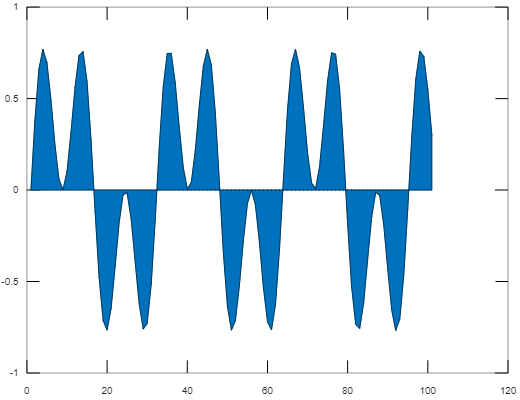
2. Area Plot
This function is used to represent the ‘y’ values as one or more curves filling the area under the curves. The curves show the relative contribution of each row element with respect to the total height of the curved at the nth interval of the ‘x’ axis.
t=[0:0.2:20];

a=[sin(2.*t).*cos(t)];

area(a)
Output:
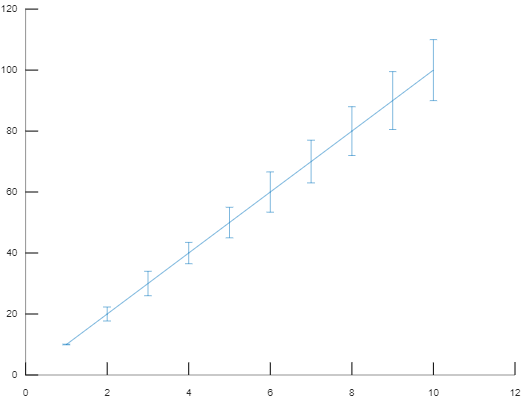
3. Errorbar Plot
This type of 2D plotting is used to draw a vertical error bar at each data point on a 2D line plot.
Code:
x=[10 20 30 40 50 60 70 80 90 100];

y=[0.1 2.3 4 3.5 5 6.6 7 8 9.5 10];

errorbar(x,y)
Output:
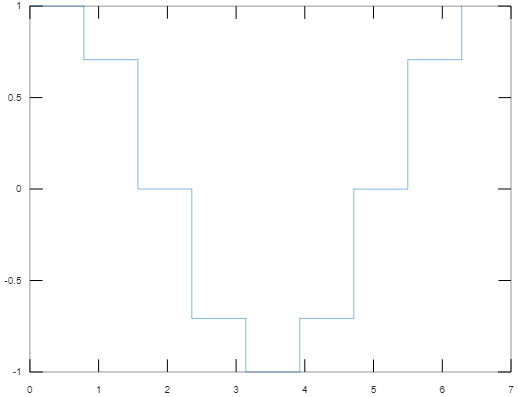
4. Stairs Plot
In this 2D plot function, the graph is generated in the form of the staircase.
Code:
x=0:pi/4:2*pi;

y=cos(x);

stairs(x,y)
Output:
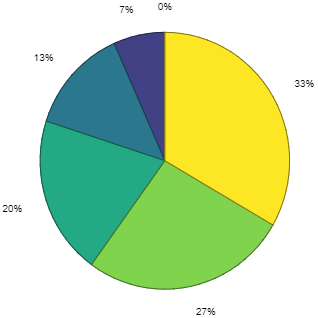
5. Pie Plot
This format is used to create the graph in the form of a pie chart for the matched element.
Code:
x=0:5:25;

pie(x)
Output:
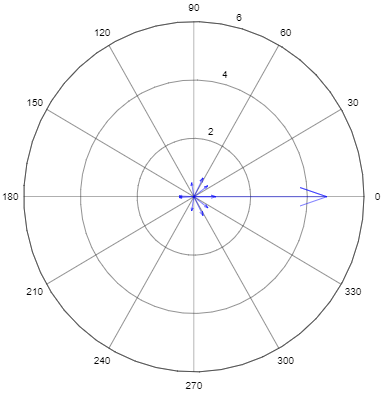
6. Compass Plot
This graph is used to represent the element in vector format emanated from its origin.
Code:
m=rand(10,10);

e=eig(m);

compass(e)
Output:
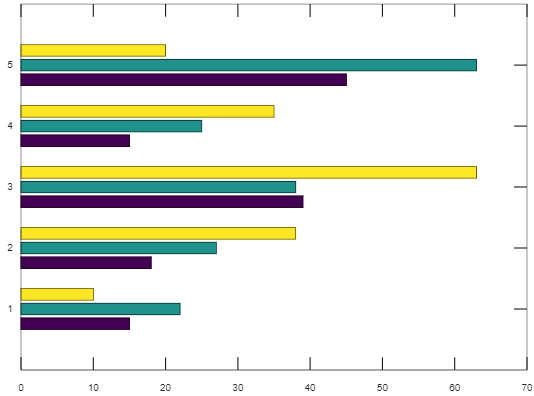
7. Barh Plot
This format is used to represent the dependent variable value by distributing bars horizontally.
Code:
Y = [15,22,10

18,27,38

39,38,63

15,25,35

45,63,20];

barh(Y)
Output:
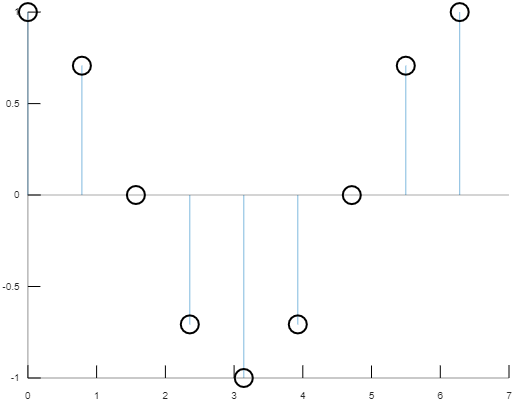
8. Stem Plot
This format is used to represent the data points in the form of stems that begins from the baseline along the ‘x’ axis.
Code:
x=0:pi/4:2*pi;

y=cos(x);

stem(x,y)
Output:
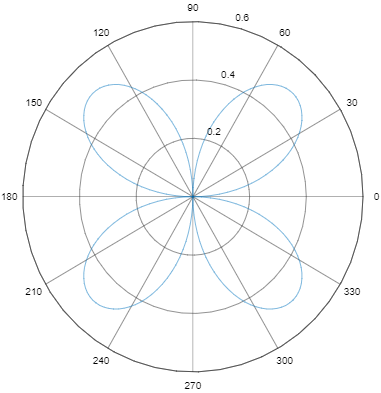
9. Polar Plot
This format creates the graph with polar coordinates with the values of theta i.e. the angle in radian and the values of rho i.e. the radius for each data point.
Code:
theta = 0:pi/100:2*pi;

rho=(sin(theta)).*(cos(theta));

polar(theta,rho)
Output:
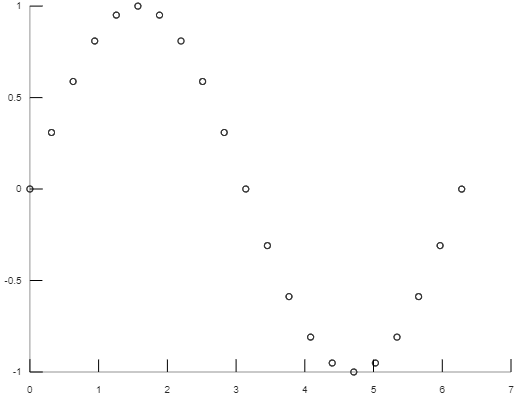
10. Scatter Plot
In this format, the data points are represented in the form of small circles corresponding to the value on ‘x’ axis.
Code:
x=0:pi/10:2*pi;

y=sin(x);

scatter(x,y)
Output:
Conclusion
2D plot in MATLAB enables a user to visualize the data which helps for further data processing. It helps to generate the graphs programmatically. Thus it makes the process of comparing data points, tracking changes in data over time, pattern in data distribution fast and easy.
Recommended Articles
This is a guide to 2D Plots in Matlab. Here we discuss attributes and types of the graph in 2D plot with proper code and output for better understanding. You can also go through our other related articles to learn more –
