Updated March 13, 2023

Introduction to Matlab Smooth
‘smooth’ function is used for getting smooth’s the response of input arguments using methods such as moving average, Savitzky-Golay filter and ‘lowess’ models or by fitting a smoothing spline.‘Smooth’ function gives the different result as compared to the filter function because smooth function ishandling at the endpoint. In matlab smooth functionwork by using two statements one is ‘smooth’ and another is ‘smoothdata’.The ‘smooth’ statement isuse for smooth response data.The ‘smoothdata’ statement is used forsmooth noisy data.‘smoothdata’ statement gives options like moving median and Gaussian methods.yy = smooth( y ) is used for smooths the response data in y variable
Syntax of Matlab Smooth
Syntax related to smooth response data:
- yy = smooth(y)
- yy = smooth(y,span)
- yy = smooth(y,method)
- yy = smooth(y,span,method)
- yy = smooth(y,’sgolay’,degree)
- yy = smooth(y,span,’sgolay’,degree)
- yy = smooth(x,y,___)
Syntax related to smooth noisy data
- B = smoothdata(A)
- B = smoothdata(A,dim)
- B = smoothdata(___,method)
- B = smoothdata(___,method,window)
- B = smoothdata(___,nanflag)
- B = smoothdata(___,Name,Value)
- [B,window] = smoothdata(___)
How does Smooth works in Matlab?
In matlab smooth ‘smooth’ statement is use for smooth response data. The ‘smoothdata’ statement is used for smooth noisy data.
The steps for smooth response data:
- Step 1: First input argument is take in the variables.
- Step 2: Then we use the “smooth” statement.
- Step 3: Then we use “subplot” and “plot” to plot the smooth response data signal.
The steps for smooth noisy data:
- Step 1: First input singnal is take in the variables which containing noise.
- Step 2: Then we use “smoothdata” to smooth noisy data.
- Step 3: Then we use “subplot” and “plot” to plot the smooth response data signal
Examples of Matlab Smooth
Following are the examples are given below:
Example #1
Let us see one example of matlab smooth. A basically smooth function used for decreasing noise contain in the signals. In this example, we discuss about how smooth function is used for reducing the noise. In this example, we take Y in the range of 0 to 30 with 0.1 differences. Then a continuous and distorted signal y generated with the help of y signal. Now we use smooth statement to reducing the noise within signal y = sin(Y) + 0.5*(rand(size(Y))-0.5) .To reducing the noise within signal loess and rloess methods are used. The processed signal is stored at yy1 and yy2 respectively. Now subplot and plot function are used to plot the data. A subplot(2,1,1) and plot(Y,y,’b.’,Y,yy1,’r-‘)is used to plot smoothed data using ”loess”’ method. A subplot(2,1,2) and plot(Y,y,’b.’,Y,yy2,’r-‘) is used to plot smoothed data using ”rloess” method.legend statement used to display data across the data.
Code:
clc ;

close all ;

clear all;

Y = (0:0.1:30)';

y = sin(Y) + 0.5*(rand(size(Y))-0.5);

y([90,110]) = 3;

yy1 = smooth(Y,y,0.1,'loess');

yy2 = smooth(Y,y,0.1,'rloess');

subplot(2,1,1)

plot( Y ,y,'b.',Y,yy1,'r-')

set(gca,'YLim',[-1.5 3.5])

legend('Original data','Smoothed data using ''loess''',...

'Location','NW')

subplot(2,1,2)

plot(Y,y,'b.',Y,yy2,'r-')

set(gca,'YLim',[-1.5 3.5])

legend('Original data','Smoothed data using ''rloess''',...

'Location','NW')
Output:
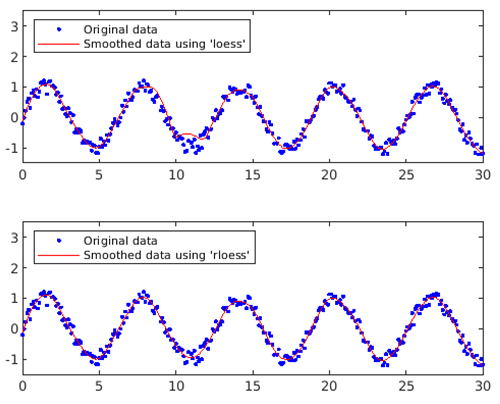
So the smooth function get reduced the unwanted signal from the original signal. Fig 1 shows the graphs two graphs one is Original data and Smoothed data using the loss method. And another is Original data and Smoothed data using the loess method.
Example #2
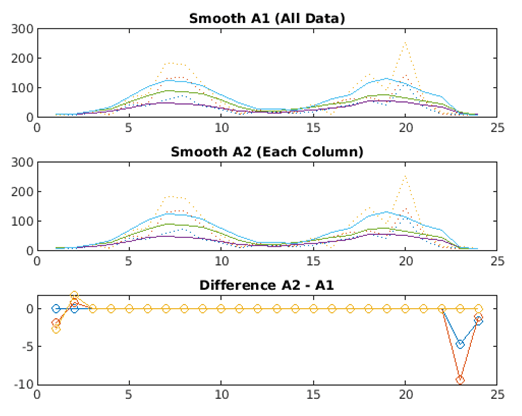
Let us see another example of a smooth function. The basically smooth function used for decreasing noise contain in the signals. In this example, we smooth a24-by-3 array count which contains counts at three intersections using smooth statement In this example data file (count.dat ) is loaded. Data with the noise is a parent in this data file. The 24-by-3 array count contains counts at three intersections. Thus, smoothing column wise gives a more meaningful picture of the count through each intersection. Here we use the moving average filter to smooth each column of the data separately with smooth function. Subplot and plot function used toplot the original data and the data smoothed by linear index and by each column separately. After that, we plot the difference between the two smoothed data sets that are A2 – A1. These two methods give different results near the endpoints. The title function is used for giving the title to the graphs.
Code:
clc;

close all;

clear all;

load count.dat

A = smooth(count(:));

A1 = reshape(A,24,3);

A2 = zeros(24,3);

for I = 1:3

A2(:,I) = smooth(count(:,I));

end

subplot(3,1,1)

plot(count,':');

hold on

plot(A1,'-');

title('Smooth A1 (All Data)')

subplot(3,1,2)

plot(count,':');

hold on

plot(A2,'-');

title('Smooth A2 (Each Column)')

subplot(3,1,3)

plot(A2 - A1,'o-')

title('Difference A2 - A1')
Output:
Conclusion
In this article we saw the concept related to matlab smooth, basically, matlab smooth is used for reducing the noise within a input arguments. Then saw syntax related to matlab smooth statements and how it is used in matlab code. Also, we saw some examples related to matlab smooth statement.
Recommended Articles
This is a guide to Matlab Smooth. Here we discuss the introduction and how does smooth works in matlab? along with different examples and its code implementation. You may also have a look at the following articles to learn more –
