Updated July 29, 2023

Definition of Market Equilibrium
Buyers and sellers react to price changes. When prices are high, the buyer reduces consumption; when prices are low, the seller reduces production. Theoretically, in a free market condition, the demand for a product equals the supply of a product, and the price remains constant. This state is market equilibrium.
Hence at this stage, as there is no inventory left, i.e. whatever is produced has been sold and is called market clearing. This stage is a balance where consumer and producer behavior is consistent, and none of the participants has any incentive to change such behavior.
Features of Market Equilibrium
Given below are the features mentioned:
- The amount demanded by the customer equals the amount supplied by the seller.
- The quantity supplied and demanded is equal to the equilibrium quantity.
- The price charged is equal to the equilibrium.
From the below table, we notice that the equilibrium price is INR 6 at a Quantity of 50 as demand equals supply. The vertical axis in the graph denotes the prices, and the horizontal axis shows the quantity. The point at which both lines intersect is the market equilibrium.
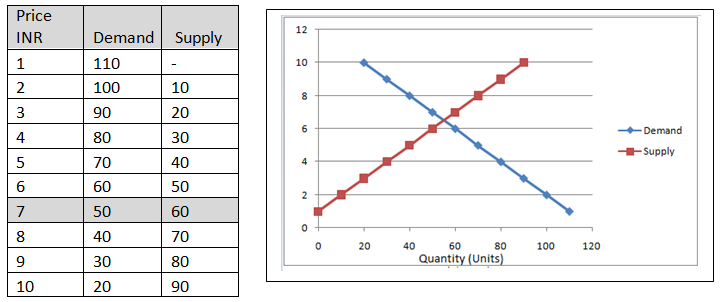
We can’t say that the equilibrium price is INR 4 since the quantity demanded is 70 and only 30 are supplied. Thus, the competition will push the price, and suppliers will produce more. On the contrary, if the price is INR 8, the quantity demanded is 30, and 70 are supplied. In this case, the competition will push the price down, and the producers will curtail production.
When the prices exceed INR 6, the market is not at equilibrium; hence, the demand and supply forces will push the market towards equilibrium by adjusting the prices.
Example #1
Company A sells Mangoes. During summer, there is a great demand and equal supply. Hence the markets are at equilibrium. The supply will start falling post-summer season, and demand might remain the same. Company A will increase the prices to take advantage and control the demand. Once the prices are high, the demand will slowly drop, bringing the markets again to equilibrium.
New Equilibrium Point: Equilibrium price may change due to changes in supply or demand Variables. Demand and supply variables change due to external factors that include higher prices, availability of cheaper substitute goods, changes in income, changes in raw material prices and overhead costs, technology changes, government policies, seasonality of products, disruption in the economy, etc. Hence, the above factors might push the prices and reach a new equilibrium point.
Example #2
An increase in earnings will increase the disposable income in the hand of consumers and thereby increasing demand. In the below table (kindly compare it to the table above), we note that due to an increase in earnings, the demand has gone up by 10 units. In this case, demand and supply are equal at the price of INR 7 compared to INR 6 in the above table. The increase in demand has raised the prices and reached a new equilibrium.

As noted above, a rise or fall in consumer earnings impacts demand and prices. This comparative study of two static equilibria to each other is Comparative Statics.
Market Equilibrium price and quantity can be computed mathematically.
1. The demand and supply equation is a pre-requirement for such a calculation. The mathematical equation expresses the correlation between the number of goods demanded with the factors that impact the willingness and capability of a consumer to buy the products.
Example:
Demand= 200-15P. Supply=5P Here, 200 is the repository of all relevant non-specified factors that affect demand for the product. P is the price of the good. As per the law of demand, the coefficient is negative. The demand for the good would fall as the consumer’s income increased.
2. Demand=Supply.
- Hence 200-15P = 5P.
3. P gives the equilibrium price for the product. So P=10 (200/20P)
4. Once the equilibrium price is put into either demand or supply function and solved, which will give you equilibrium quantity demand and supply.
- Demand = 200-15(10)
- Demand =50.
- Supply = 5(10)
- Supply = 50.
The study of Market equilibrium focuses on analyzing the interrelationship or inter-dependence between prices of commodities or between prices of commodities and factors of production. Market equilibrium can be analyzed by partial equilibrium analysis and general equilibrium analysis.
Analysis of a secular variable keeping others unchanged is Partial equilibrium analysis. The variable may either be a single price, a single consumer, a single firm, or a single individual. The position of the single variable is viewed in isolation. Hence dependency between variables (e.g. prices and production costs) is ignored. A partial analysis analyzes each variable in great detail and thus assists in understanding general equilibrium analysis.
Example #3
The fall in Crude oil prices to USD 50 per barrel would have little impact on prices of the price of house properties. In the case of house property prices, a partial analysis would be reasonable since we can assume that the prices remain constant. When considering the automobile market, changes in crude oil prices directly link to automobile prices, demand, and supply. Hence, partial equilibrium analysis is useless, and general equilibrium analysis should be used. General equilibrium analyzes the interrelationship between commodities or economic factors. An extensive analysis method uses a detailed partial equilibrium analysis to define the entire economy’s equilibrium position. Equilibrium is a situation of balance due to the equal action of demand and supply forces which mostly occurs in a perfectly competitive market.
Recommended Articles
This has been a guide to Market Equilibrium. Here we have discussed the features of Market Equilibrium, and we have taken some examples to understand Market Equilibrium. You may also take a look at some of the useful articles here –

