Updated July 11, 2023
What is Marginal Utility?
The marginal utility determines the shift (rise/fall) in customer satisfaction as they consume additional units of a product/service.
For example, a consumer eats a donut for the first time. It tastes fantastic, and they try another. However, eating another isn’t as satisfying as the first or second. Therefore, in terms of marginal utility, we can say that with every extra piece of donut, the consumer has, the utility (craving) for the food item decreases.
It is an economic concept that measures the utility of the last unit consumed. The idea says that the more of a product one has, the less valuable it becomes. As we use more of a good/service, we get less utility from every additional unit.
Key Takeaways
- It is the benefit a consumer derives from consuming one more unit of a good or service.
- This theory is also known as the law of diminishing marginal utility. It states that as we consume goods, we derive less and less satisfaction from each additional unit consumed.
- To calculate, divide the total utility change by the total units consumed.
- One can classify it into three types: positive, negative, and neutral. Positive utility means increasing utility with each added unit, while negative means vice versa. Neutral is when the extra quantity does not affect its utility.
History
- The foundation of this concept arose when economists in the 19th century were trying to figure out how to measure a product’s value. The originating theory was that one could determine a product’s value only by its utility and customer satisfaction.
- When economists further studied this notion, they arrived at the paradox of diamond and water. Which states that even though water is the basis of life and of high importance to human life, diamonds are more valuable.
- The economists then introduced the marginal utility per the scarcity principle; the more scarce the product, the more valuable each additional unit is. In this case, a diamond’s value increases with increasing units, whereas water does not. The same goes for any other commodity.
- Finally, in the 20th century, the concept became well-known to world economists.
How Does Marginal Utility Work?
- It refers to the subjective value a consumer assigns to a good/product consumed. Consumers place different values on each unit, which means their preferences change depending on what they have already consumed.
- As we start with fewer units of something, the utility may be higher than when we begin with more pieces. For example, when one is thirsty and has no water, they place a high value on one gallon of water. On the other hand, if someone is slightly dehydrated and has plenty of water, they might not care about getting another gallon of water.
- It is usually the difference between total and average utility. Moreover, it can be applied to any product or service and helps us understand how people’s preferences change as they consume more of something.
Law of Diminishing Marginal Utility
- When we spend money to buy additional units of a good, there is a DMU.
- According to it, each additional unit provides less utility than the previous one, regardless of the amount per unit increases. Simply put, as the quantity of a good/service consumed increases, its utility decreases.
- For example, buying a can of milk during necessity assigns it higher utility. However, purchasing another can of milk when it is already available decreases its value.
- Essentially, this law dictates that we need less of a good over time because we eventually become accustomed to it.
- One can illustrate this law using graphs where we plot the total satisfaction on the y-axis against the quantity consumed on the x-axis. The slope is negative until it eventually becomes vertical as consumption increases without bounds.
Law of Equi Marginal Utility
Explanation
- The fundamental idea about the law of equi-marginal utility is to derive maximum satisfaction through marginal utility.
- Generally, it states that consumers must allocate their income among various goods to derive equal utility.
- Suppose a student with $100 has to buy school supplies. They can gain maximum satisfaction if they distribute the amount in books, stationery, backpack, etc.
Assumptions
- The price of the product/service and the consumer’s income are established and will not change.
- The consumer requires multiple goods/services, understands their utility, and wants to maximize satisfaction.
- Each product’s usefulness is quantifiable using numbers without fractions or decimals (1, 2, 3, etc.).
Limitations
- For most commodities, quantifying utility in cardinal numbers can be difficult.
- If the prices are subject to change regularly or if the consumer’s income is meager, it can pose an objection to the law.
- It is not a suitable measure for knowledge gain.
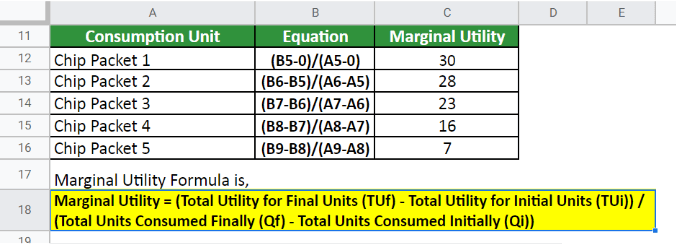
Marginal Utility Formula
The mathematical equation for marginal utility of consumption is,
(OR)
Where,
- TUi and TUf are the total usefulness of Qi and Qf Units, respectively.
- Qi and Qf are the total consumption initially and finally, respectively.
How to Calculate Marginal Utility – Examples
Example 1
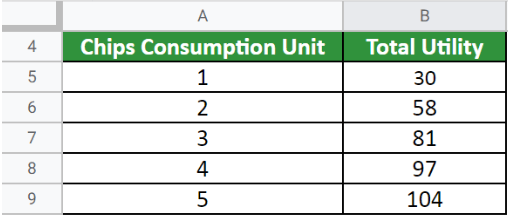
A customer purchases five chips packets and records the total utility after consuming each pack as follows,
We calculate the marginal utility for each chip packet as follows,
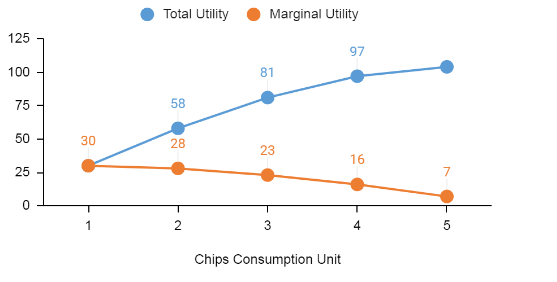
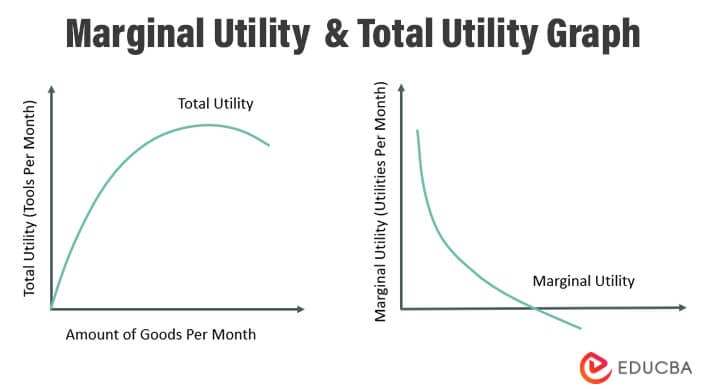
This graph represents the comparison between the total and marginal utility. It shows that with each additional unit, total utility increases while marginal decreases.
Example 2
Ms. Z buys three units of a good and reports the total utility as 40. However, sometime later, she purchased additional four units and said the final utility was 65. Calculate the marginal utility of the product.
Given,
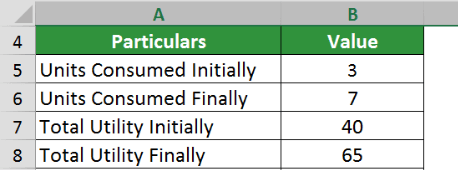
Let us calculate the change in total utility and consumed units,
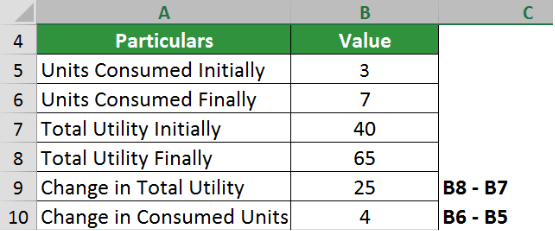
Implementing the formula,
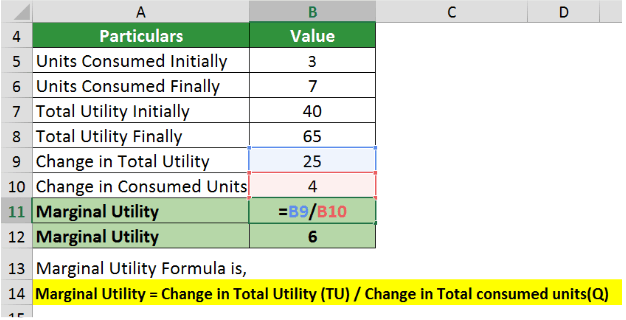
The marginal utility for goods consumed is 6.
Types
1. Positive or Growing
- It is when consuming an additional unit raises its marginal value. The more a consumer acquires the product, the more interested and satisfied they are with it.
- For instance, the more educational books one has, the more utility it produces.
2. Lowering or Negative
- Decreasing utility occurs when the utility of each unit decreases with additional consumption. It is also known as diminishing marginal utility.
- For example, if you’re thirsty on a hot day, the first glass of water will provide much greater satisfaction than your second. The last sip will be incredibly unsatisfying if you continue drinking until you’re full.
3. Neutral
- It is when the consumption of additional units does not affect the product’s value; it remains constant.
- For example, a person can buy any number of clothes but never feel less or more satisfied with them. As a necessity, they are always on the neutral side.
Marginal Utility and Total Utility
Marginal Utility
- The product’s value concerning total units determines whether the use of each unit from first to last rises or falls.
- It is called marginal because the utility provided by each unit decreases as the number of units increases.
- The graph for this begins at the same level as a total utility but then has a downward slope.
Total Utility
- It is the contentment a person experiences after consuming a certain quantity of one or more products.
- In this case, the utility also rises as a product’s unit count rises.
- The graph representation for total utility starts lower and then has an upward curve.
Marginal Utility Curve
- The marginal utility curve represents the optimal quantity of a product an individual wants to consume. It derives from the law of diminishing returns, which states that with more units consumed, the satisfaction gained with each additional unit decreases.
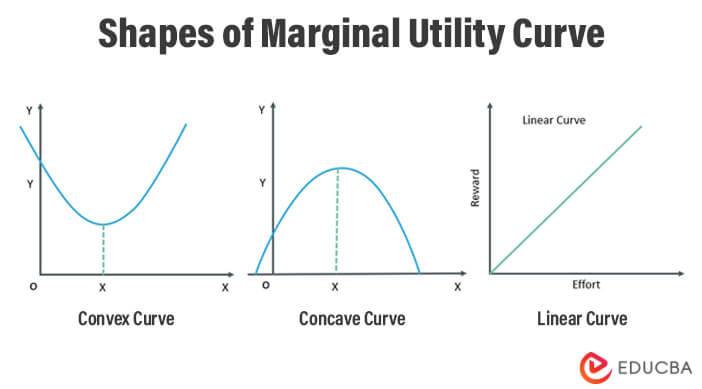
- The curve demonstrates this by showing how total satisfaction increases at an increasing rate up until a certain point when it levels off or even dips. The shape of the curve can be convex, concave, and linear.
- A convex curve is similar to a U. The satisfaction increases with consumption upto a point and eventually decreases. For example, we may enjoy eating one cookie but not four.
- A concave curve looks like an upside-down U. The satisfaction starts high while consumption is at zero but then declines as consumption increases. Moreover, it reaches a point where satisfaction is lowest and then begins to increase again.
- The linear curve has no curvature, and its slope is constant over the entire range. It plots the curve for everyday goods with an income elasticity greater than 1, i.e., their demand increases as people’s incomes increase. For example, food and clothing are both common goods.
Advantages & Disadvantages
Advantages
- It is a central concept in microeconomics that determines the total goods an individual can/will consume
- Companies use this measure to gauge the product satisfaction of second-time consumers.
- This concept allows scientific evaluation of consumer perception shifts regarding satisfaction levels.
Disadvantages
- The curve only applies to those who have already reached a certain level of satisfaction.
- It assumes people will always want more rather than be satisfied with what they have.
- It is a qualitative and assumption-based metric. Hence, it can be challenging to measure. People have different preferences, so they may not share their preferences’ intensity.
Calculator
Use the following calculator for Marginal Utility calculations.
| Total Units Consumed Initially (Qi) | |
| Total Units Consumed Finally (Qf) | |
| Total Utility for Initial Units (TUi) | |
| Total Utility for Final Units (TUf) | |
| Marginal Utility = | |
| Marginal Utility = | (Total Utility for Final Units (TUf) - Total Utility for Initial Units (TUi)) / (Total Units Consumed Finally (Qf) - Total Units Consumed Initially (Qi)) ?> |
| = | (0 - 0) / (0 - 0) = 0 |
Frequently Asked Questions(FAQs)
Q1. Explain marginal utility.
Answer: Marginal utility, in economics, says that the value of an additional unit of a product/service differs from the value of the previous unit. It typically measures how much satisfaction one can get from consuming another unit of a good/service.
Q2. Define the diminishing marginal utility law.
Answer: It generally has three types: positive, negative, and neutral. The negative one is also known as DMU. The law of DMU states that its usefulness will decline with an increase in total units consumed.
Q3. What is the marginal utility of money?
Answer: Also known as the marginal utility of income, it claims that the utility law applies not only to commodities/services but also to people’s income. As one’s income grows, their satisfaction level will improve, but it is not constant. At a certain point, any income growth would not bring any additional satisfaction to the person.
Q4. What is the importance of marginal utility?
Answer: It is a tool that can help consumers regulate spending to receive maximum utility from various products. Consumers can use this measure when deciding whether or not it is worth purchasing additional units.
Recommended Articles
This article explains everything about Marginal Utility. To learn more, read the following articles,
