


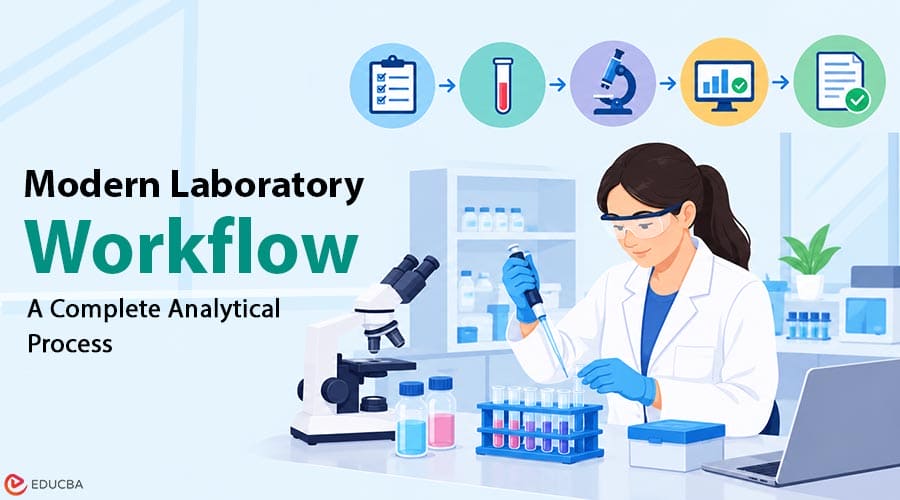
Modern laboratories transform physical samples into meaningful scientific information through a carefully controlled sequence of steps. A reliable laboratory workflow connects sample collection, preparation, analysis, quality control, data processing, and reporting. Whether a laboratory is analyzing environmental samples, food and beverages, pharmaceutical materials, chemicals, biological specimens, or industrial products, reliable results rarely depend on a single instrument or procedure. They depend on the entire analytical workflow.
From the moment a sample enters a laboratory until scientists review and report the final result, they must consider sample integrity, preparation methods, analytical techniques, reference materials, instrument performance, data quality, and documentation. Understanding this workflow provides valuable insight into how modern analytical laboratories like zwitserslab operate and why seemingly small details can significantly affect result quality.
1. Sample Collection: Where the Analytical Process Begins?
Every laboratory analysis begins with a sample. A sophisticated analytical instrument cannot compensate for a sample that does not accurately represent the material being investigated. For this reason, sampling is often considered one of the most important stages of the analytical process. The appropriate collection method depends heavily on the material being examined. A water sample may require a specific type of bottle, while a chemical product, soil sample, food product, or biological material may require completely different collection procedures.
Several factors must be considered during sampling, including:
- Sample representativeness
- Container compatibility
- Potential contamination
- Required sample volume
- Temperature
- Light exposure
- Transportation conditions
- Storage duration
Containers must also be appropriate for the substance being analyzed. An unsuitable container could interact with the sample, introduce contaminants, or allow important components to degrade. Proper labeling is equally important. Laboratories typically establish identification systems that track samples throughout the analytical process. This concept is often called sample traceability.
2. Sample Reception and Documentation
Once a sample reaches the laboratory, it normally enters a controlled reception process. The laboratory may record sample information in a laboratory information management system or another documentation system. Depending on the laboratory, this information can include the sample identification number, origin, collection date, requested analysis, storage requirements, and relevant handling instructions. Laboratory personnel may also examine the sample’s condition.
For example, laboratory personnel might check whether a container is damaged, whether the correct quantity was supplied, or whether specified transportation conditions were maintained. Good documentation establishes a clear connection between the original sample and every subsequent analytical step. This becomes particularly important when laboratories process hundreds or thousands of samples.
3. Sample Preparation
Sample preparation is one of the most extensive parts of analytical science. Most samples cannot simply be placed directly into an analytical instrument. They usually require some form of preparation first. The objective is to create a sample suitable for the selected analytical method while preserving the compounds or characteristics to be measured.
Depending on the application, preparation can involve:
- Dilution: Reducing the concentration of a sample to an appropriate analytical range.
- Filtration: Removing particles that could interfere with analysis or damage instrumentation.
- Extraction: Separating target compounds from the original sample matrix.
- Centrifugation: Separating materials according to density.
- Homogenization: Producing a more uniform sample.
- Evaporation or concentration: Increasing the concentration of target compounds.
- Chemical treatment: Modifying the sample so that particular compounds can be detected more effectively.
Sample preparation can significantly influence the final analytical result. Poor preparation may introduce contamination, cause analyte loss, or create unwanted interference.
4. Filtration and Sample Cleanup
Filtration is widely used in analytical laboratories, particularly before chromatographic analysis. Small particles suspended in a liquid sample can create several problems. They may obstruct tubing, increase pressure within an analytical system, contaminate an instrument, or interfere with the resulting chromatogram. Syringe filters and membrane filters are therefore commonly used to remove unwanted particles.
Selecting a filter involves more than choosing a diameter. Scientists may consider membrane chemistry, pore size, solvent compatibility, sample composition, and potential interactions between the membrane and the analyte. Typical membrane materials include PTFE, nylon, PVDF, PES, and regenerated cellulose. Different materials have different chemical properties, making filter selection an important part of method development.
5. Extraction and Purification
Complex samples often contain many substances unrelated to the compounds scientists want to measure. Extraction techniques help separate those compounds from the surrounding matrix. One commonly used approach is solid-phase extraction (SPE). In a typical SPE procedure, a sample passes through a sorbent designed to retain certain compounds. Scientists can then remove interfering materials before recovering the compounds of interest with an appropriate solvent.
A simplified SPE workflow may involve:
Conditioning → Sample Loading → Washing → Elution
Other extraction methods include liquid-liquid extraction, protein precipitation, QuEChERS, and various specialized purification procedures. The best technique depends on the analytical objective and sample characteristics. Effective cleanup can improve analytical sensitivity, reduce matrix interference, and help protect analytical instruments from contamination.
6. Preparing Samples for Instrumental Analysis
After preparation and purification, the sample must usually be transferred into a suitable container for instrumental analysis. For chromatography, this commonly means an autosampler vial. Although a vial may seem like a simple laboratory component, its specifications can matter. Laboratories may need to consider glass composition, vial volume, insert design, cap type, septum material, and chemical compatibility. The vial must also work correctly with the autosampler being used.
Contamination introduced at this stage can compromise otherwise careful sample preparation. Laboratories therefore pay attention to the cleanliness and suitability of vials, caps, septa, inserts, syringes, filters, and other consumables that come into contact with the sample. Scientific suppliers such as Zwitsers Lab support these workflows by providing laboratory products used across sample preparation, chromatography, analytical standards, and related research applications.
7. Chromatographic Separation
Once a prepared sample reaches the analytical instrument, one of the most important stages can begin: separating its components. Chromatography is among the most widely used analytical techniques for this purpose. Two major approaches are gas chromatography (GC) and liquid chromatography (LC).
A. Liquid Chromatography
High-performance liquid chromatography, commonly known as HPLC, moves a liquid mobile phase containing the sample through a column packed with a stationary phase. Different compounds interact with these phases in different ways.
As a result, compounds travel through the column at different rates and can be separated before detection. UHPLC, or ultra-high-performance liquid chromatography, uses similar principles but with systems and columns designed to operate under different conditions, often involving smaller particles and higher pressures.
B. Gas Chromatography
Gas chromatography generally suits compounds that can vaporize under the method’s conditions. A carrier gas moves compounds through a GC column. Their interactions with the stationary phase and differences in physical and chemical properties allow them to separate. Both techniques have extensive applications across research, environmental science, food analysis, pharmaceutical testing, chemical analysis, and industrial laboratories.
8. The Importance of the Analytical Column
In chromatography, the column is central to separation. Columns differ in dimensions, stationary-phase chemistry, particle characteristics, and other specifications.
Selecting an appropriate column depends on factors such as:
- Analyte chemistry
- Sample complexity
- Required resolution
- Analytical technique
- Mobile-phase conditions
- Temperature
- Desired analysis time
Two analytical methods using the same instrument can produce dramatically different separations simply because they use different column chemistries. This is why column selection and method optimization are major areas of chromatographic science.
9. Detection: Turning Separation Into Information
Separating compounds is only part of the process. The analytical system also needs a way to detect them. Different detectors measure different physical or chemical characteristics. HPLC systems may use ultraviolet or visible absorbance detectors, fluorescence detectors, refractive index detectors, or mass spectrometers. GC systems can use flame ionization detectors, thermal conductivity detectors, electron capture detectors, mass spectrometers, and other technologies.
The detector converts the resulting signal into analytical data. In chromatography, the system often displays this information as a chromatogram, where individual compounds may appear as peaks. Scientists then evaluate characteristics such as retention time, peak area, peak height, resolution, and peak shape.
10. Reference Standards and Calibration
Detecting a signal does not automatically tell a scientist how much of a particular substance is present. Quantitative analysis frequently requires calibration. Scientists can analyze reference materials or analytical standards containing known quantities of specific compounds under controlled conditions. Their responses provide reference points to evaluate unknown samples.
For example, a laboratory may prepare several known concentrations and use the resulting instrumental responses to construct a calibration curve. Scientists can then compare the unknown sample’s response with that curve. The quality, preparation, storage, documentation, and appropriate use of reference materials can therefore directly affect analytical reliability.
11. Quality Control
Quality control does not occur only at the end of an experiment. It should be integrated throughout the workflow. Depending on the method, laboratories may analyze blanks, controls, replicates, calibration standards, reference materials, and system suitability samples. A blank can help identify contamination. Replicate measurements can indicate precision. Control samples can help laboratories monitor whether an analytical procedure continues to perform within established parameters.
Chromatography laboratories may also monitor parameters such as retention-time consistency, peak shape, resolution, detector response, pressure, and baseline stability. If the results do not meet the quality-control criteria, scientists may investigate the cause before accepting them.
12. Data Processing and Interpretation
Modern analytical instruments can generate large amounts of data. Software helps laboratories process signals, integrate chromatographic peaks, calculate concentrations, compare results, and organize analytical records. However, automated processing does not eliminate the need for scientific review. An unusual peak, unexpected retention-time shift, poor baseline, abnormal calibration result, or inconsistent replicate may require further investigation.
Scientists must determine whether an unusual result reflects the sample or an analytical problem. Possible causes can include contamination, sample degradation, preparation errors, instrument problems, unsuitable method conditions, or data-processing issues.
13. Reporting and Traceability
The final stage is converting analytical data into a usable result. Depending on the laboratory, this may take the form of a research report, certificate, analytical record, internal quality-control document, or electronic dataset. Good laboratory documentation should allow scientists to understand how they obtained the result.
Relevant records may include sample identification, preparation procedures, instrument methods, calibration information, analytical standards, instrument performance data, calculations, and quality-control results. Traceability provides a documented path from the original sample to the reported result.
The Laboratory Workflow is a Connected System
It is tempting to think of modern laboratory analysis primarily in terms of sophisticated instruments. In reality, an instrument represents only one part of a much larger system.
You can view a reliable analytical workflow as:
Sample Collection → Documentation → Sample Preparation → Filtration/Extraction → Vial Preparation → Separation → Detection → Calibration → Quality Control → Data Review → Final Result
Every stage influences what comes next. Excellent chromatography cannot necessarily correct poor sampling. A highly sensitive detector cannot automatically compensate for contamination. Accurate reference standards cannot eliminate errors introduced during sample preparation. The strength of modern analytical science therefore comes from controlling the complete workflow.
Final Thoughts
The journey from sample to result demonstrates how interconnected laboratory processes have become. Sample handling, preparation, filtration, extraction, chromatography, detection, calibration, quality control, and data interpretation all contribute to the reliability of the final analytical result. Technology continues to improve laboratory speed, sensitivity, automation, and data processing. Yet the fundamental principle remains unchanged: reliable scientific results depend on a reliable process.
Understanding the complete laboratory workflow helps researchers make better decisions about methods, instruments, consumables, reference materials, and quality-control procedures. More importantly, it highlights why analytical science is not simply about obtaining a number from an instrument, it is about building a documented and controlled chain of evidence from the original sample to the final result.
Recommended Articles
We hope this comprehensive guide to laboratory workflow helps you better understand modern analytical processes and achieve reliable laboratory results. Check out these recommended articles for more insights and strategies to improve your laboratory practices.