Updated June 12, 2023
GROWTH Formula in Excel
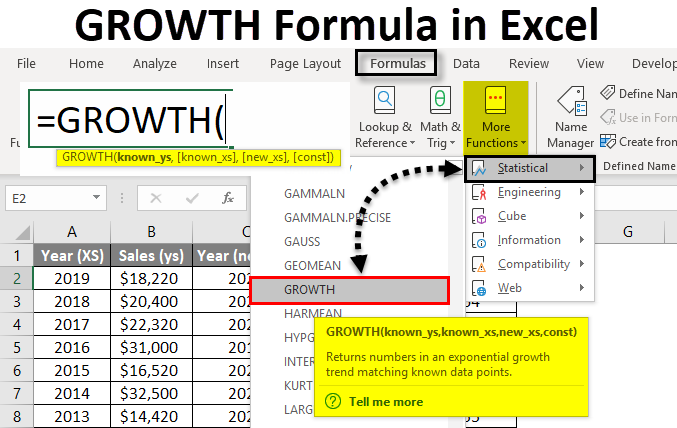
The growth formula in Excel is a statistical function. The growth formula returns the predicted exponential growth rate based on existing values given in Excel. It is found under Formulas<More Functions<Statistical<Growth. It is a worksheet function. The growth formula is available in all versions of Excel. This function is used for statistical and financial analysis. It helps in predicting and forecasting revenues and sales targets of companies. The growth formula is also used in Regression analysis in Excel.
The growth function calculates Y values based on an exponential growth rate of given X values.
Below is the Formula for GROWTH in Excel :
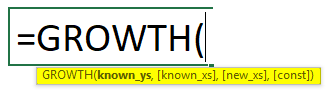
The GROWTH Formula has the below arguments.
- known_y’s: This is a set of known Y’s values. This is a required argument. These values are used for estimating growth.
- known_x’s: This is the provided set of X’s values. It is also used to estimate exponential growth. It’s an optional argument, and in its absence, it is assumed that the array is of the same size as that of known_Y’s
- New_x’s: It is an optional argument. It is the value for which we use the Growth function to calculate the corresponding predictive y-values. But if this is omitted, the values of new_x’s are assumed to be the same known_x’s values. This will return the y values on the exponential growth curve*
*Exponential Growth Curve in Excel:
For the Growth formula, Y = b*m^X
It represents an exponential curve in which the value of Y depends upon the value of X, m is base with X as its exponent, and b is constant.
- Const: It is also an optional argument. It can be True or false. When it is True, b is calculated. When this is False, b is taken as 1; when this argument is not given, it is assumed as True and calculated normally.
This is a very helpful function to estimate or forecast exponential growth.
How to Calculate GROWTH in Excel using Formula?
It is very simple and easy. Let’s understand how to calculate GROWTH in Excel with some examples.
Example #1
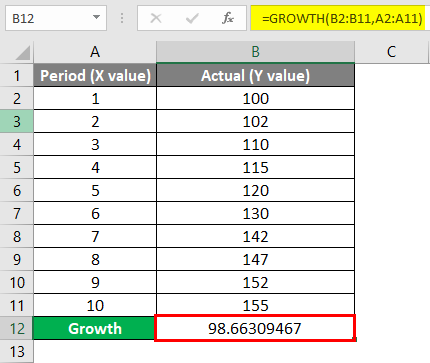
We have a data table wherein we have Period as known_x’s and Actual as known_y’s. The data is in the table below:
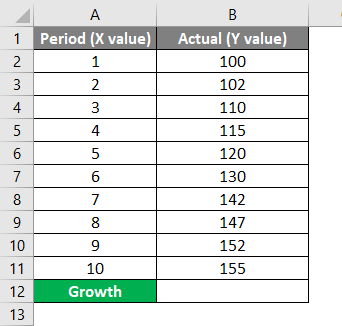
We will write the formula below:
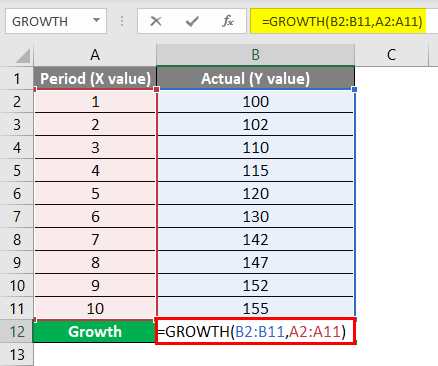
Now we will press the Enter key to see the estimated growth.
Example #2
We have sample data that shows months and their corresponding revenues. We will now estimate the revenue for the month of December (12) using the Growth formula in Excel.
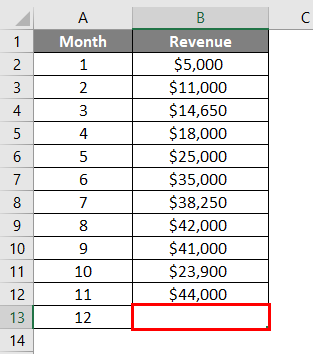
We will write the formula below:
We will input cell B2 to B12 as known _y’s, A2:A12 as known_x’s, and A13 as new_x’s.
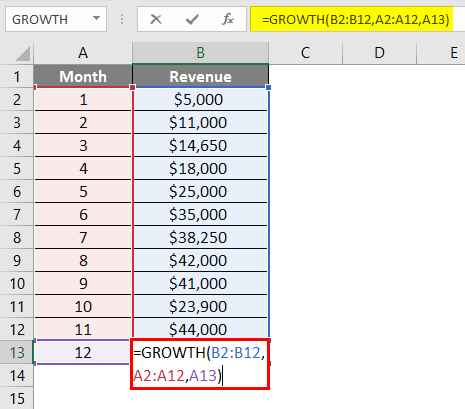
Press the Enter key to see the result.
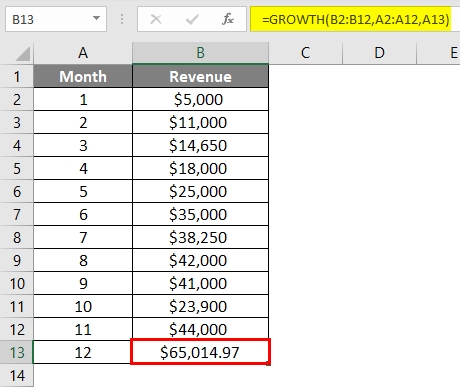
So the estimated revenue for the 12 months is $65,014.97.
Example #3
Suppose we wish to know whether a certain sales figure can be achieved for the coming financial year. So we want to achieve sales of $12 million.
We have a sample data table:
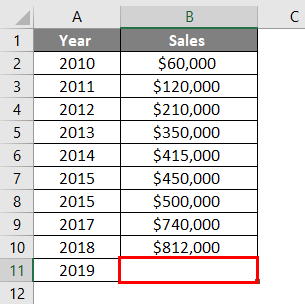
- Here Known_y’s are the sales values given.
- Known_x’s are the year for which we have sales values.
- New_x’s is the year for which we will calculate the value. So the new_x’s will be cell A11 (for 2019).
We will write the formula:
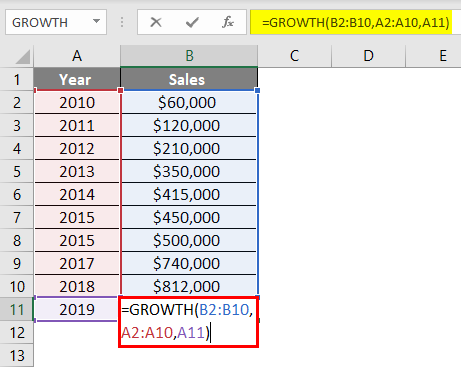
The output will be :
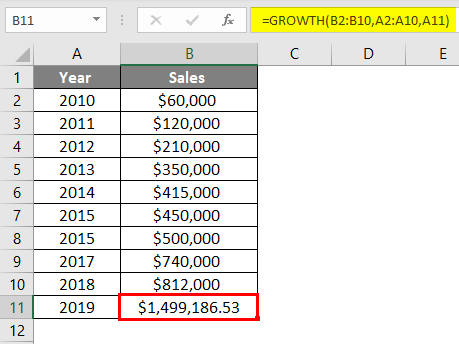
Hence, in the year 2019, most probably, the sales will be above the estimated 12 million.
Example #4
Taking the above formula, if we want to know the estimated sales for 2019, 2020, and 2021.
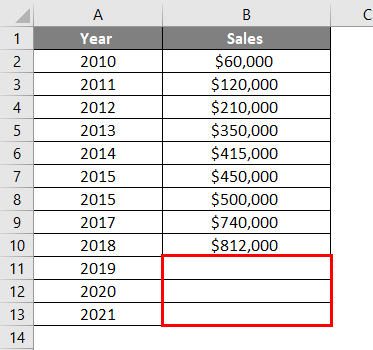
Now we will write the formula:
Here the known_y’s re cells B2: B10, known_x’s are the years we have sales data. Here it will be A2: A10. Now the new_x’s will be from cells A11 to A13.
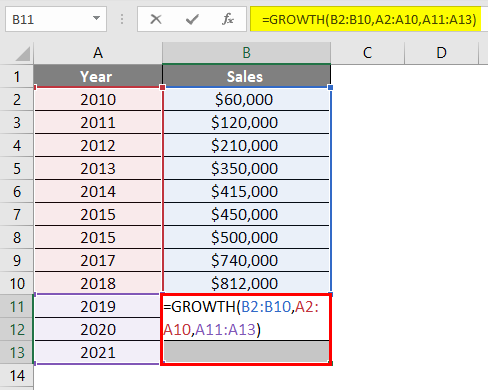
We will now press CTRL+SHIFT+ENTER to execute it as an array function. Hence you will see the curly brackets.

We now have estimated sales for the year 2019= $1,499,186.53, year 2020 =$2,035,556.33 and year 2021 = $2,763,825.23
Example #5
To make things more clear, let’s take another example.
We have year wise revenue data of a company, and we want to forecast the revenue for the current year.
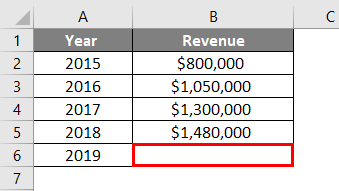
We will now write the formula in cell B6:
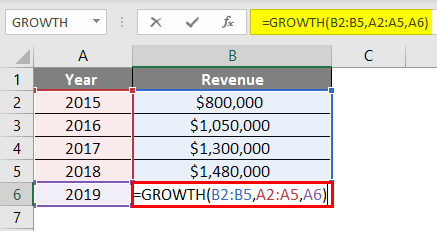
Press the Enter key to get the output.
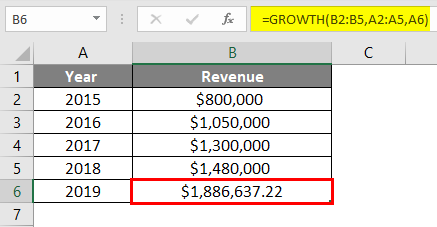
The estimated revenue for the year 2019 will be $1,886,637.22.
Example #6
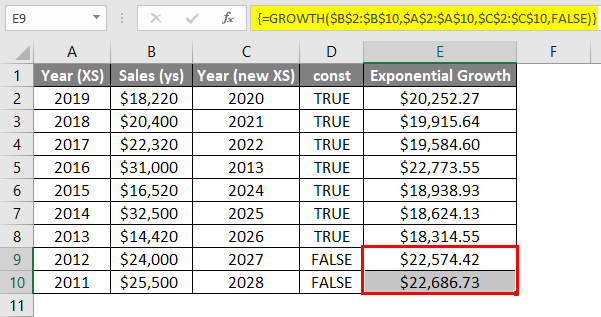
We will now look into an example of exponential growth. We have a sample data table.
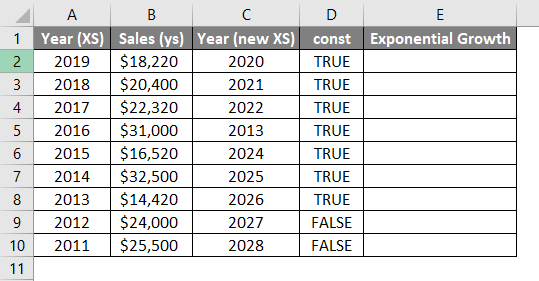
We will now write the formula below:
Here known_y are cells B2:B10, known_x’s are cells A2:A10, new_x’s are cells D2:D10 and const are TRUE (till E8). We will input the cell ranges and will lock them by pressing F4.
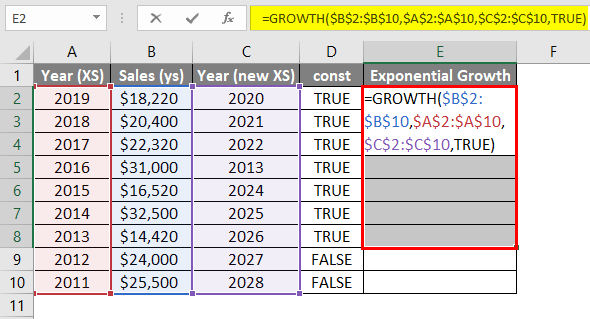
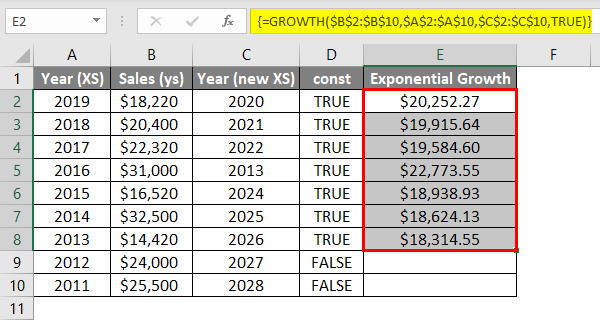
Once we have written the formula, we will press CTRL+SHIFT+ENTER to execute the array.
We will write the formula for the remaining years where const is False.
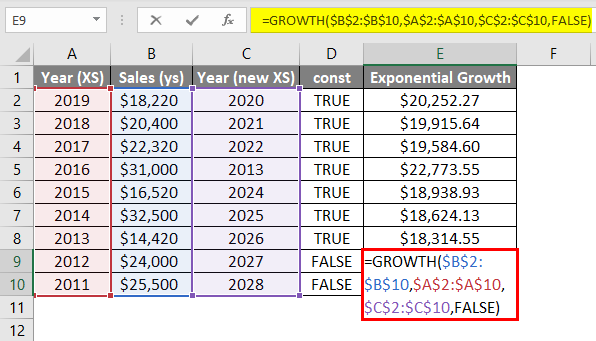
Press the CTRL+SHIFT+ENTER key simultaneously to get the output.
Things to Remember
While using the Excel growth formula, we must be careful while writing the formula correctly. We will not get the correct result if we input the wrong syntax. It would rather give some errors. Some of these are as follows Hence keep the below-mentioned points in mind while using the function.
- While using the Growth formula, you may get the #REF! Error. This error will show up when the length of known_x’s array isn’t the same as known_y’s.
- The #NUM! error will occur if any value of known_y’s array is less than or equal to zero.
- The #VALUE! An error occurs when known_y’s, known_x’s, or new_ x’s value is not numeric or a text.
- In growth function graphs, we often create a scatter chart of the data rather than a line. We use the exponential option from the graph trend line option.
- The exponential growth function Use the exponential growth function as an array formula when you need to calculate multiple new values of y. So an array formula executes using the Crtl+ Shift+ Enter and not Enter.
Recommended Articles
This has been a guide to the GROWTH Formula in Excel. Here we discuss How to calculate GROWTH in Excel, practical examples, and a downloadable Excel template. You can also go through our other suggested articles –
