Updated March 13, 2023
Introduction to Exponential in Matlab
In day to day life, we need mathematics. There are lots of functions in mathematics and exponential is one of the important functions. Many times there is a need for exponential values of the data. To get the exponential value in Matlab we used an exponential statement. As well as in some cases there is a need to plot the exponential graph. So for that first, we had exponential data and this is possible in MATLAB by using exponential statement.
Syntax:
The syntax for Exponential in Matlab is as shown below:
y1 = exp(x1)
How to do Exponential in Matlab?
For Exponential plotting of the data, we use exp and plot statements.
The steps for Exponential plotting of the data using exp and plot statement:-
Step 1: we take variables and assign values.
Step 2: then we use exp to get exponential values of the variable.
Step 3: then we use a plot statement with appropriate syntax to plot the exponential graph to visualize the exponential data.
Examples
Let us discuss examples of Exponential in Matlab.
Example #1
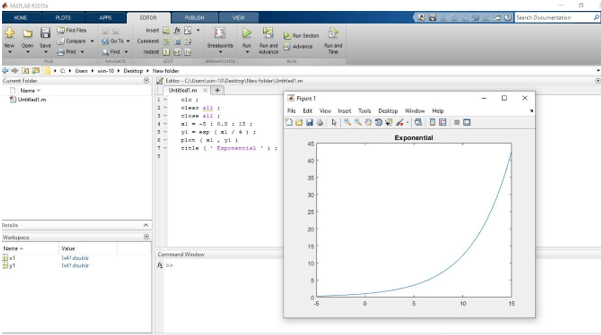
Let us see an example related to exponential in Matlab, for exponential we use a Matlab syntax as ‘exp’, exp in parenthesis we take that variable names or we directly take the equation for exponential. In this example, we display the exponential signal also using a plot function. Firstly we take a range of axis -5 to 15 with a difference of 0.5, this range we take in an x1 variable. Then we write an exponential equation using exp function, we take an exp in parenthesis x1 is divided by 4 and these exponential values are assigned to variable y1, the equation is y1 = ex1/4, the value of x1 is varied from -5 to 15 and according to that the different values are assign to y1 variable. Then we plot a signal using x1 and y1 variable and plot function, plot is an inbuilt function available on Matlab it is plots the data in y1 versus the corresponding values in x1, x-axis is x1 which is varying from -5 to 15 comma y-axis is a function of x1. And this is an exponential signal related to the given equation.
Matlab code for example 1-
clc;

clear all;

close all;

x1 = -5 : 0.5 : 15 ;

y = exp ( x1 / 4 );

plot ( x1 , y )

title ( ' Exponential ' );
Output:
Example #2
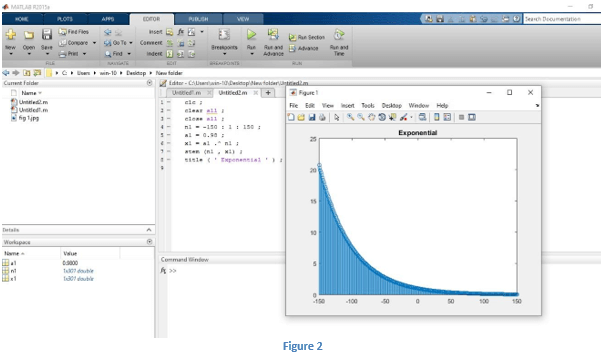
Let us see an example for exponential in Matlab, the exponential signal is defined as x1of n1 is equal to alpha (a1) power n1 U of n1. Where alpha is the rate at which exponential signal is increasing or decreasing n1 is an independent variable which is varying from minus infinity to plus infinity so therefore there are two parameters are here one is alpha and another one is independent variable n1 let me define those two, n1 is usually varying from minus infinity to plus infinity but since we cannot reach infinity so will start with -150 to 150 in steps of 1. Now we define a1 as equal to 0.98 this is my alpha, there is a condition that is if alpha is greater than 1 the signal x1 of n1 is exponentially increasing if alpha (a1) is in between 0 to 1 then the signal x1 of n is exponentially decreasing signal, so our example the value of alpha is 0.98 so it will give me exponentially decreasing signal. Now define x1 of n1 is equal to alpha dot power n1 and then stem, stem for discrete signal, the x-axis is n1 which is varying from -150 to 150 comma y-axis is a function of n1.
Matlab code for example 2:
clc;

clear all;

close all;

n1 = -150 : 1 : 150 ;

a1 = 0.98;

x1 = a1 .^ n1;

stem (n1 , x1);

title ( ' Exponential ' );
Output:
Example #3
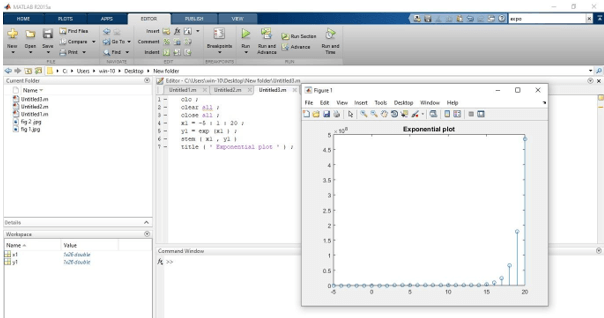
Let us see an example related to exponential in Matlab, for exponential we use a Matlab syntax as ‘exp’, exp in parenthesis we take that variable names or we directly take the equation for exponential. Firstly we take a range of axis -5 to 20 with a difference of 1, this range we take in an x1 variable. Then we write the exponential equation using exp function, we take an exp in parenthesis x1 is multiply by 2 and these exponential values are assigned to variable y1, the equation is y1 = e^x, the value of x1 is varied from -5 to 20 and according to that the different values are assigned to y1 variable. Then we plot a signal using x1 and y1 variable and stem function, stem is an inbuilt function available on Matlab it is plot district signal for the data in y1 versus the corresponding values in x1, the x-axis is x1 which is varying from -5 to 20 comma y-axis is a function of x1. And this is an exponential signal related to a given equation. And then we take a title function to give a title to that figure.
Matlab code for example 3:
clc ;

clear all ;

close all ;

x1 = -5 : 1 : 20 ;

y1 = exp (x1 ) ;

stem ( x1 , y1 )

title ( ' Exponential plot ' ) ;
Output:
Conclusion
In this article, we saw the concept of exponential in Matlab. Basically, exponentials are used for returns the exponential value. Then saw syntax related to exponential and how it is used in Matlab code. Also, we saw some examples related to exponential and its output on Matlab.
Recommended Articles
This is a guide to Exponential in Matlab. Here we discuss the introduction, How to do Exponential in Matlab? and examples with code implementation respectively. You may also have a look at the following articles to learn more –
