How Smart Data Models Are Transforming Labor Statistics?
In the data-driven world, accurate employment statistics are crucial for effective policymaking and economic planning. Yet many developing countries struggle to produce reliable employment data, especially at local levels where it matters most. A groundbreaking approach using Dynamic Bayesian Hierarchical Models (DBHM) can change this landscape, offering a powerful solution to improve employment survey estimates in data-scarce regions.
The Challenge of Local Employment Data
Imagine trying to fight unemployment without knowing which districts need help the most. That is the reality many policymakers face in developing countries. Take India, for instance. While the Periodic Labor Force Survey (PLFS) provides reliable national and state-level data, district-level estimates are often unreliable due to small sample sizes. In some cases, reported unemployment rates fluctuate widely from year to year, not because of underlying economic changes but because of statistical noise.
This creates a serious problem for policymakers. How can they effectively target job training programs or allocate employment funds without knowing where the need is greatest? Simply conducting more surveys is not always feasible due to cost and logistical constraints. This is where smart statistical modeling steps in.
The Power of “Borrowing Strength” with Dynamic Bayesian Hierarchical Models
The DBHM approach works by “borrowing strength” across both space and time. Instead of treating each district as an isolated data island, it connects similar regions across time periods. Think of it as filling in a puzzle: when pieces are missing in one area, you can make educated guesses based on the surrounding pieces and the overall pattern.
This method is particularly powerful because it:
- Reduces wild swings in estimates by recognizing that unemployment rates typically change gradually
- Makes better use of limited data by incorporating information from similar regions
- Provides more reliable confidence intervals, helping policymakers understand the uncertainty in their decisions
How Do Dynamic Bayesian Hierarchical Models Work?
where:
- μ is the overall intercept representing a global baseline unemployment rate.
- ui,t captures deviations over time for area ii.
- σ2 is the process variance.
At its core, DBHM combines two key statistical ideas. First, it uses hierarchical modeling to link geographic areas, enabling information to flow between similar regions. Second, it incorporates time dynamics, recognizing that the unemployment rate is related to yesterday’s.
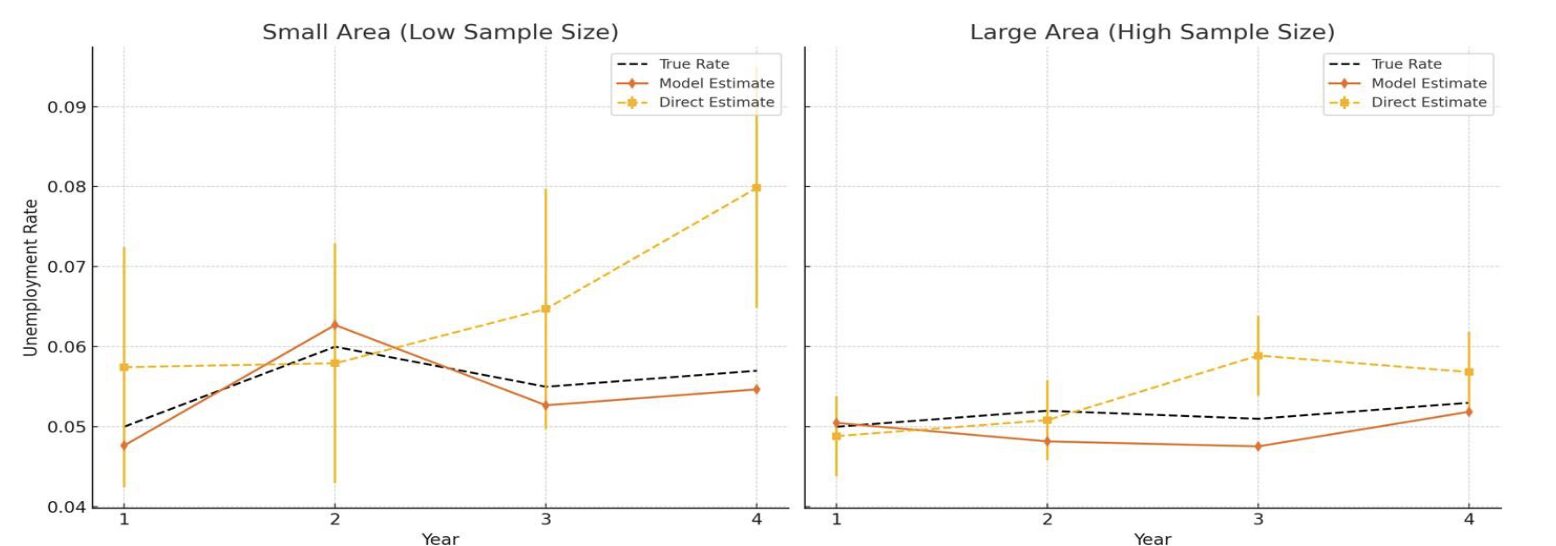
The model works like a sophisticated filter, smoothing out statistical noise while preserving genuine trends. When applied to India’s PLFS data, for example, it can transform volatile district-level estimates into more stable, reliable indicators without requiring additional data collection.
Real-World Impact
The practical benefits of DBHM are significant. Simulation studies using Indian labor force data show that it can reduce estimation errors by more than 50% in small-sample areas compared with traditional methods, giving policymakers greater confidence in local unemployment figures. For example, in a rural district, traditional estimates might show unemployment jumping from 5% to 9% in a year—an unlikely scenario. DBHM smooths such fluctuations while capturing real labor-market changes, enabling more precise targeting of programs like India’s MGNREGA (rural employment guarantee scheme) and job-training initiatives to areas with persistent unemployment rather than temporary statistical spikes.
Other Examples of real-world impacts can be:
- In the Andean regions of Peru, DBHM could enhance understanding of indigenous women’s economic participation, particularly in remote highland communities where traditional surveys struggle to capture seasonal agricultural work and artisanal production.
- In post-conflict or fragile states such as South Sudan, DBHM provides a statistical bridge, enabling humanitarian agencies to estimate labor conditions and design emergency employment programs despite weak data infrastructure.
Cost-Effective and Practical
One of the most attractive features of DBHM is its practicality. The method works with existing survey data and runs on open-source statistical software. This makes it particularly valuable for developing countries, where data collection resources are limited.
Australia and several European countries already use similar approaches for their regional labor statistics. The method has proven reliable and cost-effective, serving as a model for developing nations.
Challenges and Considerations
While DBHM offers significant advantages, it is not without challenges. The method assumes that unemployment rates change gradually over time, which may not capture sudden economic shocks, such as those caused by a pandemic. It also requires statistical expertise to implement properly.
However, these limitations are manageable. The model can be adapted to handle unusual events, and statistical offices can build capacity through training and partnerships with academic institutions.
Future Possibilities
The potential applications of DBHM extend beyond basic unemployment statistics. This method can:
- Track underemployment and informal employment
- Monitor labor market outcomes for specific demographic groups
- Combine survey data with administrative records and digital labor market information
- Create real-time labor market monitoring systems
Final Thoughts
As developing countries continue to strengthen their statistical systems, approaches such as DBHM offer a pathway to improved data without the need for substantial investments in new surveys. For policymakers, this means more reliable information for decision-making. For citizens, it means better-targeted employment programs and more effective use of public resources. The future of labor statistics lies not just in collecting more data but in making more effective use of the data we already have.
Dynamic Bayesian Hierarchical Models represent a significant step forward in this direction, helping to ensure that no region or community falls through the cracks due to poor data quality. For countries pursuing inclusive growth and equitable development, adopting such innovative statistical approaches is not just a technical upgrade—it is a moral imperative. Better data enables better decisions, which ultimately improve outcomes for those who need support most.
Author: Dharmateja Priyadarshi Uddandarao

Dharmateja Priyadarshi Uddandarao is a distinguished data scientist and statistician whose work bridges the gap between advanced analytics and practical economic applications. With a Master’s in Analytics from Northeastern University and a bachelor’s in computer science from the National Institute of Technology, Trichy, Dharmateja has led initiatives at major tech companies like Capital One and Amazon, applying sophisticated statistical methods to real-world problems.
Recommended Articles
We hope this guide on Dynamic Bayesian Hierarchical Models helps you understand their role in improving employment estimates. Explore these recommended articles for deeper insights and related applications.
