What are Debugging Tools?
Debugging tools are software applications or features that help developers detect, identify, and resolve bugs or errors in their code. These tools can aid in inspecting code execution, analyzing runtime data, and providing insights into the program’s behavior at various stages of execution. Debugging tools vary in functionality, but they all serve the purpose of enhancing the debugging process by providing critical information about the application’s internal state.
Table of Contents:
- Introduction
- Why are Debugging Tools Essential?
- Top 10 Debugging Tools
- How to Choose the Right Debugging Tool?
Why are Debugging Tools Essential?
Here are the top reasons why every developer should integrate debugging tools into their workflow:
- Increased Productivity: Debugging tools accelerate issue detection, reducing manual code tracing time and increasing overall developer efficiency.
- Better Code Quality: They help proactively catch logical, syntax, and runtime errors, ensuring cleaner, more reliable, and maintainable codebases.
- Improved Testing: Debugging tools support early bug detection during development, reducing defects that might reach production environments.
- Enhanced Performance: They identify performance issues, such as memory leaks, excessive CPU usage, and slow operations, and improve application responsiveness.
- Easier Maintenance: Debugging tools simplify understanding and fixing problems in complex, legacy, or unfamiliar code written by others.
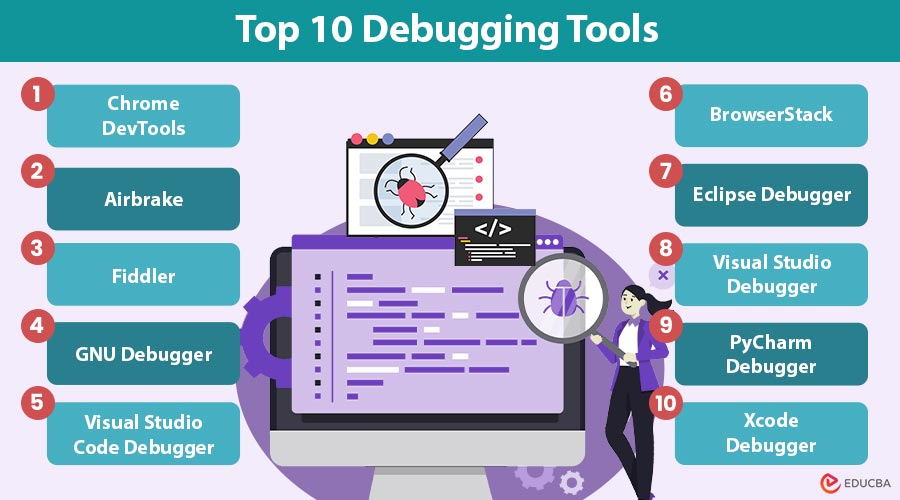
Top 10 Debugging Tools Every Developer Should Know
Here are the top debugging tools every developer should use to detect, analyze, and fix bugs efficiently across different platforms.
1. Chrome DevTools
Chrome DevTools is a built-in debugging tool in the Google Chrome browser. It enables developers to inspect HTML and CSS, debug JavaScript, analyze network activity, and monitor performance in real-time.
Platform: Web
Best For: Frontend Developers
Features:
- DOM and CSS inspector
- JavaScript console
- Network throttling and performance profiling
- Mobile device simulation
- Lighthouse audits for SEO and performance
2. Airbrake
Airbrake is a cloud-based error tracking and performance monitoring tool. It collects real-time error reports from your application and helps you identify and trace issues to their root cause.
Platform: Web, Mobile, Backend
Best For: Error Tracking and Monitoring
Features:
- Real-time error alerts
- Stack trace and context analysis
- Deployment tracking
- Integration with GitHub, Slack, Jira, etc.
3. Fiddler
Fiddler records all HTTP(s) communication between your machine and the internet, making it a useful tool for web troubleshooting. Developers commonly use it to diagnose network-related issues.
Platform: Windows (with Mac/Linux support via Mono)
Best For: Network Debugging
Features:
- HTTP request/response inspection
- Performance testing and simulation
- Custom rules and filters
- Mobile traffic capture
4. GNU Debugger (GDB)
GDB is a powerful command-line debugger for C, C++, and other languages. It enables programmers to observe what a program is doing during execution or what it was doing when it crashed.
Platform: Linux, Unix
Best For: C/C++ Developers
Features:
- Breakpoints and watchpoints
- Step-by-step execution
- Stack trace inspection
- Remote debugging support
5. Visual Studio Code Debugger
Visual Studio Code Debugger is a lightweight, extensible tool offering built-in debugging for multiple languages, enabling breakpoints, variable inspection, and step-through code execution.
Platform: Windows, macOS, Linux
Best For: Full Stack Developers
Features:
- Interactive debugging UI
- Breakpoints, variable inspection, and call stacks
- Debug configurations for Node.js, Python, Java, and other languages
- Terminal and Git integration
6. BrowserStack
For web application testing, BrowserStack offers cloud-based access to actual hardware and browsers. It ensures that your app works across multiple platforms and devices.
Platform: Web
Best For: Cross-Browser Testing and Debugging
Features:
- Live and automated testing
- Real device cloud
- Developer tools and console logs
- Screenshots and video recordings
7. Eclipse Debugger
Eclipse is a popular IDE for Java with powerful built-in debugging capabilities. It supports debugging Java applications, web applications, and other types of applications.
Platform: Windows, macOS, Linux
Best For: Java Developers
Features:
- Step-in/over/out execution
- Conditional breakpoints
- Thread management
- Watch expressions and variable views
8. Visual Studio Debugger
Visual Studio offers one of the most advanced debuggers available. It supports debugging in C#, VB.NET, C++, and other languages.
Platform: Windows
Best For: .NET and C++ Developers
Features:
- Immediate Window and Watch tools
- IntelliTrace (historical debugging)
- Live Unit Testing
- Remote and cloud debugging
9. PyCharm Debugger
PyCharm, developed by JetBrains, features a robust debugger specifically designed for Python. It is especially useful for debugging Django, Flask, and data science applications.
Platform: Windows, macOS, Linux
Best For: Python Developers
Features:
- Graphical debugger interface
- Breakpoints and conditional logic
- Interactive Python console
- Multi-threaded and multiprocessing support
10. Xcode Debugger
Xcode Debugger, part of Apple’s official IDE, offers robust debugging for Swift and Objective-C, including breakpoints, memory graphs, and real-device testing for iOS and macOS applications.
Platform: macOS
Best For: iOS/macOS Developers
Features:
- LLDB-based debugging
- View memory graphs and object allocations
- Debug UI in Interface Builder
- Simulators and real-device testing
How to Choose the Right Debugging Tool?
Take into consideration the following elements while choosing a debugging tool:
- Language/Platform Support: Select a debugging tool that fully supports the programming languages, operating systems, and platforms your team uses, ensuring compatibility and a seamless debugging experience.
- Ease of Use: Select tools with intuitive interfaces, clean workflows, and clear documentation to reduce the learning curve and improve overall developer productivity during debugging tasks.
- Integration: Opt for debugging tools that integrate well with your CI/CD pipeline, IDE, version control systems, and other tools in your development workflow.
- Collaboration: Pick tools offering team-friendly features like shared logs, real-time commenting, issue tagging, and dashboards to enhance communication and streamline team-based debugging efforts.
- Cost: Consider your budget and choose tools offering the right balance between features and affordability, whether through free versions, trials, or paid subscriptions.
Frequently Asked Questions (FAQs)
Q1. Can debugging tools help identify security vulnerabilities in code?
Answer: Yes, they can expose insecure code, memory issues, or exceptions that may lead to potential security vulnerabilities.
Q2. What is the difference between static and dynamic debugging tools?
Answer: Static debugging tools analyze code without executing it (e.g., linters), while dynamic debugging tools inspect the application during execution to find runtime bugs.
Q3. Can debugging tools be used in cloud-native or containerized environments?
Answer: Absolutely. Tools like Visual Studio, GDB, or remote debuggers can be integrated with Docker or Kubernetes environments to debug services running in containers.
Q4. Do modern debugging tools support AI or automation features?
Answer: Yes, some advanced tools incorporate AI to predict root causes, auto-suggest fixes, or prioritize errors based on impact, improving efficiency in large-scale debugging tasks.
Final Thoughts
In the fast-paced world of software development, debugging is not just a reactive process—it is an essential part of writing clean, maintainable, and high-quality code. You can expedite your development process, find errors early, and produce better software more quickly with the correct debugging tools.
Recommended Articles
We hope that this EDUCBA information on “Debugging Tools” was beneficial to you. You can view EDUCBA’s recommended articles for more information.
