Updated July 10, 2023
Introduction to Data Mining vs Data Visualization
Data Mining is used to find patterns, anomalies, and correlations in a large dataset to make predictions using a broad range of techniques; this extracted information is used by the organization to increase their revenue, cost-cutting reducing risk, and improve customer relationships, etc. whereas data visualization is the graphical representation of the data and information extracted from data mining using the visual elements like graph, chart, and maps, a data visualization tool, and techniques help in analyzing the massive amount of information and make a decision on top of it.
Head-to-Head Comparison Between Data Mining vs Data Visualization (Infographics)
Below are the top 7 Comparisons between Data Mining vs Data Visualization:
Key Differences Between Data Mining vs Data Visualization
Following are the key differences between Data Mining vs Data Visualization:
- Data Mining is the process of sorting out large data sets, extracting some data from them, and extracting patterns from the extracted data. In contrast, Data Visualization is the process of visualizing or displaying the data extracted in different graphical or visual formats such as statistical representations, pie charts, bar graphs, graphical images, etc.
- Data Mining processes include sequences analysis, classifications, path analysis, clustering, and forecasting, whereas In Data Visualization contains processing, analyzing, communicating the data, etc.
- In Data Mining, the system automatically displays the data during the search process through self-analysis. In contrast, Data Visualization gives a clear view of the data and will be easy for the human brain to remember and memorize large chunks of data at a glance.
- Data Mining has four stages: Data Sources, Data gathering or data exploring data modeling, and deploying the data models. In contrast, In Data Visualization has seven stages: acquiring process, parsing, filtering, mining, representing, refining, and interacting.
- Data Mining is a group of different activities to extract different patterns out of the large data sets in which data sets will be retrieved from different data sources. Data Visualization facilitates complex data analysis by converting numerical data into meaningful 3D pictures and other graphical images.
- The applications of Data Mining include Customer Relationship Management, a software application that provides advantages to data mining. In contrast, the applications of Data Visualization include sonar measurements, satellite photos, computer simulations, surveys, etc.
- The different techniques available in Data Mining are Classification, Cluster, Sequence, Association, etc. Data Visualization originated from statistics and sciences, which give clear visualization at a glance, meaning a picture gives 100 words at its sight.
- In Data Mining, classification is the process of identifying the rule of the data, whether it belongs to a particular class of data or not, and its’ sub-processes include building a data model and predicting the classifications. In contrast, In Data Visualization, the main application includes geographical information systems where important geographical information can be represented as visual images that represent complex information as simply as possible.
- Data mining technologies include neural networks, statistical analysis, decision trees, genetic algorithms, fuzzy logic, text mining, web mining, etc. In contrast, Data Visualization has different applications, such as retail, government, medicine and healthcare, transportation, telecommunication, insurance, capital markets, and asset management.
- The limitations of Data Mining are such as even it is being new technology. However, it is still underdeveloped because many companies use legacy systems. Also, the existing systems are not data warehouse friendly. Data Visualization has significant disadvantages in its tools, such as showing different visuals rather than explaining, having no guidelines, other users with multiple insights, and providing poor security.
- Data Mining is an analytical process that identifies different patterns from the data sets, which can help in dealing with the flood of information and Data Visualization provides a lot of visualization techniques that have been developed over the past decades that support the exploration of large data sets.
- Data Mining uncovers hidden relationships among different data sets and variables, which is a major benefit of this field. In contrast, Data Visualization defines as it is the visual object representing the data in the form of graphs and charts.
Data Mining vs Data Visualization Comparison Table
Below is the comparison table between Data Mining vs Data Visualization:
| Basis For Comparison | Data Mining | Data Visualization |
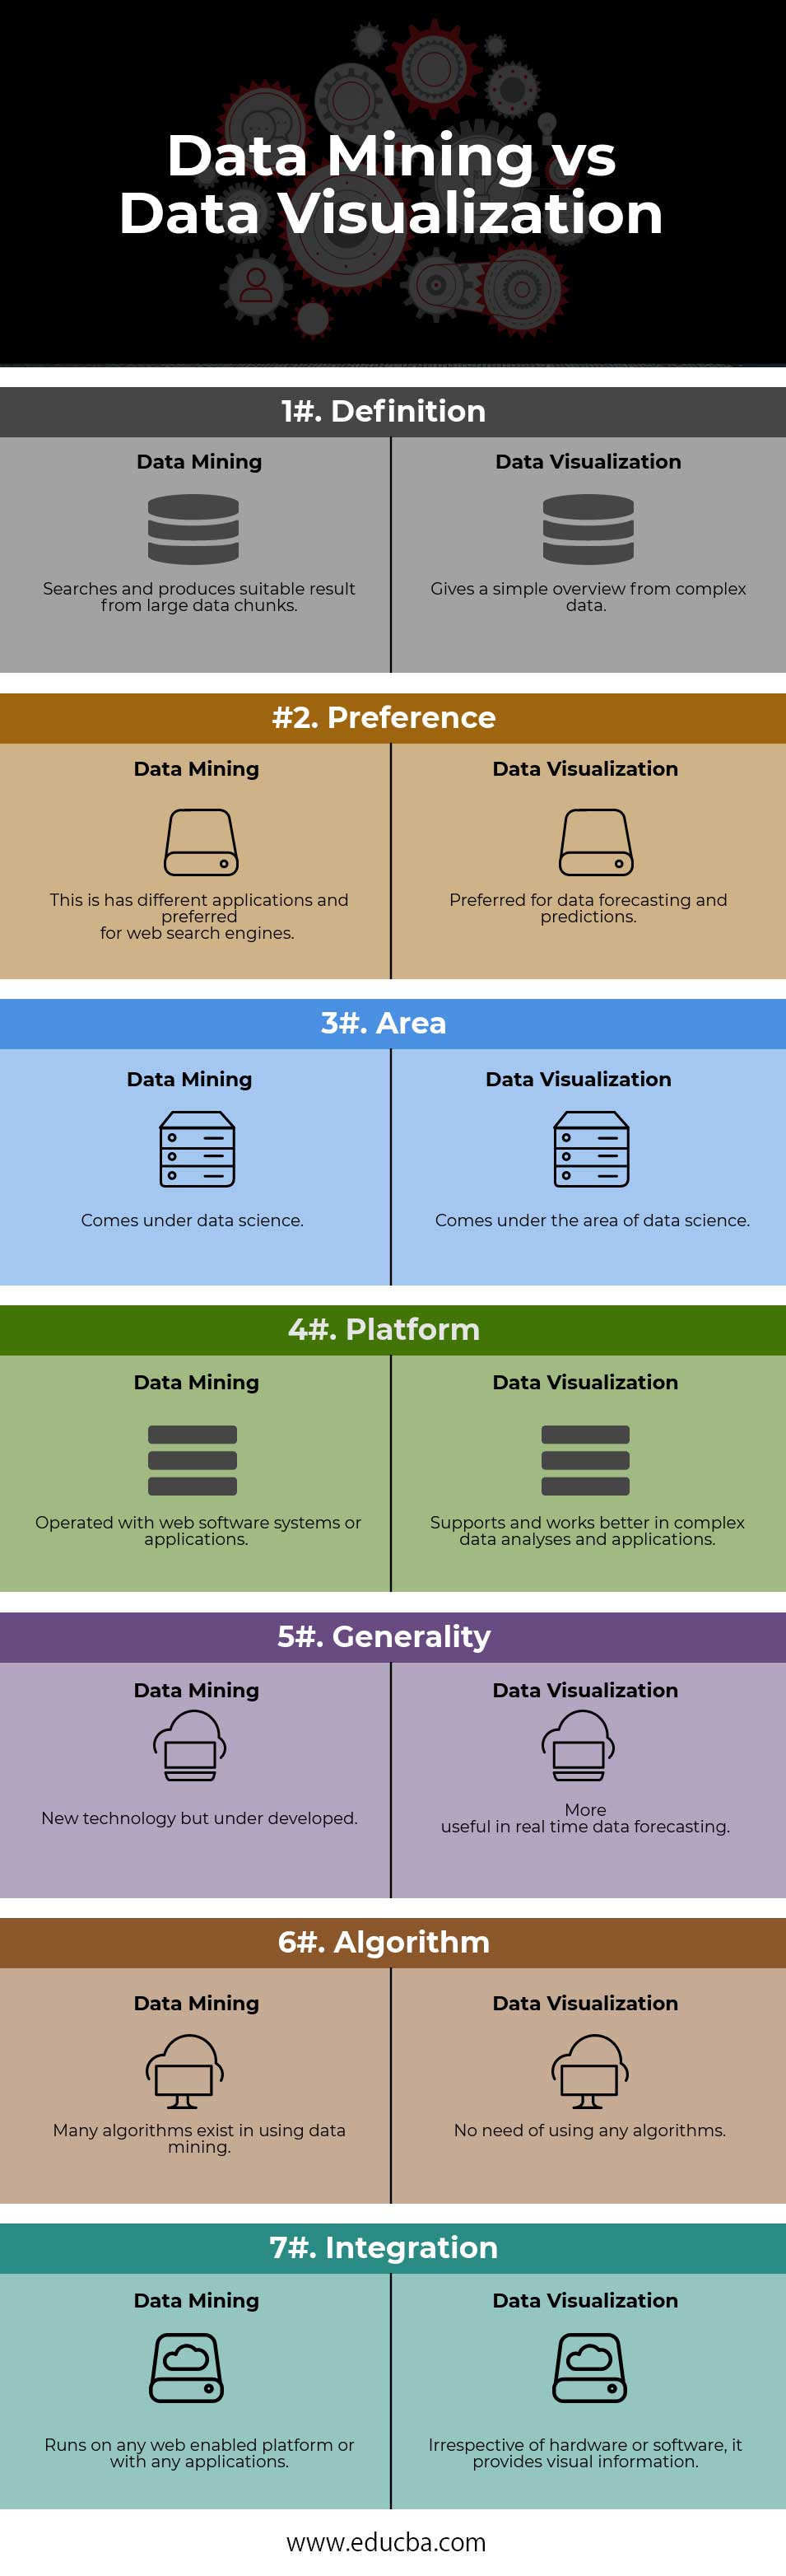
| Definition | Searches and produces relevant results from large data chunks. | Gives a simple overview of complex data. |
| Preference | This has different applications and is preferred for web search engines. | They are preferred for data forecasting and predictions. |
| Area | Comes under data science. | Comes under the area of data science. |
| Platform | It is operated with web software systems or applications. | Supports and works better in complex data analyses and applications. |
| Generality | New technology but underdeveloped. | More useful in real-time data forecasting. |
| Algorithm | Many algorithms exist in using data mining. | No need to use any algorithms. |
| Integration | It runs on any web-enabled platform or with any applications. | Irrespective of hardware or software, it provides visual information. |
Conclusion
In Data Science, professionals thoroughly process large datasets in the area of data mining to identify different patterns and provide relevant results in their search. Data Visualization is the process of displaying visual information from the existing complex data to conclusions at a glance without the need to study any theoretical results. The applications include satellite data information, research results information, scientifically studied data, etc. Data mining applications are web search engines, retail, financial and banking industries, government organizations, etc. Both data mining and data visualization have great advantages in data science applications in the computer science field.
Recommended Articles
This has been a guide to Data Mining vs Data Visualization. Here we have discussed Data mining vs Data Visualization head-to-head comparison, key differences, infographics, and a comparison table. You may also look at the following articles to learn more –
