EDUCBA

EDUCBA

MENUMENU
  • Free Tutorials
  • Free Courses
  • Certification Courses
  • 360+ Courses All in One Bundle
  • Login
Home Data Science Data Science Tutorials Matlab Tutorial Curve Fitting Matlab
Secondary Sidebar
Matlab Tutorial
  • Functions
    • MATLAB Functions
    • MATLAB user defined function
    • Calling Functions in MATLAB
    • Transfer Functions in MATLAB
    • Anonymous Functions in MATLAB
    • Inline Functions in MATLAB
    • Bessel Functions in MATLAB
    • Mean Function in MATLAB
    • Find Function MATLAB
    • Filter Function in MATLAB
    • IIR Filter MATLAB
    • Piecewise Function in MATLAB
    • Sum Function in MATLAB
    • Simulink MATLAB Function
    • MATLAB Create Function
    • MATLAB Inverse Function
    • MATLAB Count
    • Step Function MATLAB
    • MATLAB limit
    • Fminsearch in MATLAB
    • Covariance in MATLAB
    • Summation in MATLAB
    • Linear Fit MATLAB
    • MATLAB?linear regression
    • MATLAB Derivative
    • MATLAB Derivative of Function
    • MATLAB Comet()
    • Fzero MATLAB
    • xlabel MATLAB
    • Matplotlib Legend
    • Matplotlib Subplots
    • Plot graph MATLAB
    • MATLAB Format
    • MATLAB plot title
    • Multiple Plots in MATLAB
    • MATLAB Indexing
    • Ceil MATLAB
    • Curve Fitting MATLAB
    • MATLAB trapz()
    • MATLAB Normalize
    • MATLAB diff
    • MATLAB sym()
    • MATLAB Syms
    • Absolute Value MATLAB
    • MATLAB Exponential
    • Kalman Filter MATLAB
    • Low Pass Filter MATLAB
    • Bandpass Filter MATLAB
    • MATLAB Unique
    • Trapezoidal Rule MATLAB
    • MATLAB Root Finding
    • MATLAB stem()
    • MATLAB loglog()
    • MATLAB Autocorrelation
    • MATLAB Sort
    • Simplify MATLAB
    • Cumsum MATLAB
    • Eval Function MATLAB
    • Polyval MATLAB
    • MATLAB Colon
    • MATLAB Eigenvalues
    • MATLAB fit
    • Delta Function MATLAB
    • MATLAB Remainder
    • Differentiation in MATLAB
    • Permute MATLAB
    • isempty MATLAB
    • MATLAB text()
    • MATLAB Display Text
    • Varargin in MATLAB
    • MATLAB gca
    • MATLAB fill()
    • MATLAB pcolor()
    • MATLAB min
    • MATLAB xcorr
    • MATLAB? color codes
    • Semilogy MATLAB
    • MATLAB? eye
    • feval MATLAB
    • num2str in MATLAB
    • MATLAB Images
    • MATLAB Image? Segmentation
    • Imagesc MATLAB
    • MATLAB Image Processing
    • MATLAB Image Resize
    • MATLAB Flag
    • MATLAB fopen
    • Strcmp MATLAB
    • MATLAB fwrite
    • MATLAB fft()
    • MATLAB zeros()
    • MATLAB textread
    • Arctan MATLAB
    • MATLAB Scripts
    • Butterworth filter MATLAB
    • MATLAB Findpeaks
    • MATLAB find Index
    • MATLAB Cell
    • MATLAB Unit Step Function
    • MATLAB Backslash
    • MATLAB Mod
    • Size Function in MATLAB
    • Secant MATLAB
  • Basic
    • MATLAB Area Under Curve
    • MATLAB not equal
    • MATLAB max
    • MATLAB exist
    • MATLAB Table
    • MATLAB regression
    • MATLAB Lists
    • MATLAB quantile
    • MATLAB Round
    • MATLAB readtable
    • MATLAB disp
    • MATLAB Standard Deviation
    • MATLAB quadprog
    • MATLAB Transpose
    • Introduction to MATLAB
    • Advantages of MATLAB
    • MATLAB Features
    • Taylor Series MATLAB
    • MATLAB Z Transform
    • fsolve in MATLAB
    • MATLAB QR
    • Career in MATLAB
    • Uses Of MATLAB
    • MATLAB Free
    • How to Install MATLAB
    • How to Use MATLAB?
    • MATLAB Version
    • MATLAB Compiler
    • MATLAB Commands
    • MATLAB Block Comment
    • MATLAB? sprintf
    • MATLAB fprintf
    • Data Types in MATLAB
    • MATLAB Integral
    • MATLAB Double Integral
    • MATLAB boolean
    • MATLAB vpa
    • MATLAB Object
    • MATLAB Annotation
    • MATLAB Variables
    • MATLAB Global Variables
    • MATLAB Operators
    • MATLAB Logical Operators
    • MATLAB nan
    • MATLAB Patch
    • MATLAB AND Operator
    • MATLAB OR Operator
    • Vectors in MATLAB
    • What is Simulink in MATLAB
    • MATLAB Interpolation
    • MATLAB Imread
    • fscanf MATLAB
    • Euler Method MATLAB
    • Root Locus MATLAB
    • MATLAB return
    • Bode Plot MATLAB
    • Nargin MATLAB
    • MATLAB Matrix Inverse
    • MATLAB String to Number
    • MATLAB string
    • MATLAB ColorBar
    • MATLAB Surfc
    • MATLAB Concatenate
    • NUMEL MATLAB
    • MATLAB? File Extension
    • MATLAB File
    • MATLAB Smooth
    • MATLAB ones
    • Exponential in MATLAB
    • MATLAB ksdensity
    • MATLAB log
    • MATLAB Append
    • MATLAB hold on
    • MATLAB Magnitude of Vector
    • Heatmap in MATLAB
    • MATLAB xticks
    • MATLAB randn
  • Control Statements
    • IF-Else Statement in MATLAB
    • If Statement in MATLAB
    • Loops in MATLAB
    • For Loop in MATLAB
    • While Loop in MATLAB
    • do while loop in MATLAB
    • Nested Loop in MATLAB
    • Switch Statement in MATLAB
    • Break in MATLAB
  • Matrix
    • Matrix in MATLAB
    • 3D Matrix in MATLAB
    • Transpose Matrix MATLAB
    • Sparse Matrix in MATLAB
    • Matrix Multiplication in MATLAB
    • Identity Matrix in MATLAB
    • MATLAB?writematrix
  • Advanced
    • MATLAB Class
    • Arrays in MATLAB
    • Matlab find value in array
    • MATLAB Grader
    • Power Spectral Density MATLAB
    • Matlab Textscan
    • String Array in MATLAB
    • MATLAB Random Numbers
    • Matlab Dot
    • MATLAB 2D Array
    • MATLAB? zero padding
    • MATLAB sort matrix
    • MATLAB Plot Function
    • 2D Plots in MATLAB
    • 3D Plots in MATLAB
    • MATLAB Fread
    • Spectrogram MATLAB
    • MATLAB Average
    • MATLAB exponent
    • MATLAB not enough input arguments
    • MATLAB comment
    • MATLAB zpk
    • Scatter Plots in MATLAB
    • MATLAB 3d scatter plot
    • Bar Graph in MATLAB
    • Bar Plot MATLAB
    • Log Plot MATLAB
    • Polar Plot in MATLAB
    • Surface Plot in MATLAB
    • MATLAB Plot Circle
    • Boxplot in MATLAB
    • MATLAB Plot Multiple Lines
    • Linspace MATLAB
    • Histogram in MATLAB
    • Plot Vector MATLAB
    • MATLAB Legend
    • MATLAB Plot Legend
    • MATLAB ezplots
    • Column Vector MATLAB
    • MATLAB Plot Marker
    • MATLAB LineWidth
    • MATLAB Line Style
    • Contour plot in MATLAB
    • MATLAB Sine Wave
    • Reshape in MATLAB
    • Natural Log in MATLAB
    • Random Number Generator in MATLAB
    • Complex Numbers in MATLAB
    • MATLAB Figure
    • Heatmap in MATLAB
    • MATLAB Technical Computing
    • Colors in MATLAB
    • Colormap in MATLAB
    • MATLAB Plot Colors
    • MATLAB fplot()
    • MATLAB Stacked Bar
    • MATLAB sphere()
    • MATLAB cylinder()
    • MATLAB mesh()
    • Pie Chart in MATLAB
    • MATLAB Gradient
    • Grid on MATLAB
    • Repmat in MATLAB
    • dlmread in MATLAB
    • Meshgrid in MATLAB
    • MATLAB Struct
    • MATLAB Cross Product
    • MATLAB colorbar Label
    • MATLAB Save Variable
    • MATLAB Saveas
    • MATLAB Cell Array
    • Polynomial in MATLAB
    • ismember MATLAB
    • Heaviside MATLAB
    • MATLAB rref
    • MATLAB polyfit()
    • MATLAB xlim
    • MATLAB Variance
    • Optimset MATLAB
    • Quiver MATLAB
    • Newton Raphson MATLAB
    • Mat2cell MATLAB
    • Magnitude MATLAB
    • format long MATLAB
    • Dot Product MATLAB
    • Jacobian MATLAB
    • What is Matlab?
    • Convolution MATLAB
    • Moving Average MATLAB
    • Fourier Series MATLAB
    • Gaussian Fit MATLAB
    • Bisection Method MATLAB
    • Laplace Transform MATLAB
    • Fourier Transform MATLAB
    • Signal Processing MATLAB
    • MATLAB Forms
    • Complex Conjugate MATLAB
    • MATLAB Write to File
    • uigetfile MATLAB
    • MATLAB Toolbox
    • MATLAB Errorbar
    • MATLAB Index Exceeds Matrix Dimensions
    • Nyquist MATLAB
    • Impulse Response MATLAB
    • xlsread MATLAB
    • MATLAB xlswrite
    • Matplotlib Scatter
    • MATLAB Import Data
    • MATLAB Export Data
    • MATLAB Read CSV
  • Programs
    • Square Root in MATLAB
    • Square Wave MATLAB
    • Squeeze MATLAB
    • Factorial in MATLAB
    • Cell to String MATLAB
  • Interview Questions
    • MATLAB Interview Questions

Related Courses

MATLAB Certification Course

R Programming Course

All in One Data Science Courses

Curve Fitting Matlab

By Priya PedamkarPriya Pedamkar

Curve Fitting Matlab

Introduction to Curve Fitting Matlab

The Curve Fitting module is used for graphical user interfaces (GUIs) and M-file entities. It built on the MATLAB technical computing environment. The toolbox provides you feature like Data pre-processing such as sectioning and smoothing. A graphical environment (GUIs) that allows you to explore and analyze data sets and fits visually and numerically and also save your work in various formats including M-files as well as binary files and workspace variables. In this topic, we are going to learn about Curve Fitting Matlab.

Syntax

q= polyfit ( a,y,n)
[q,S] = polyfit(a,y,n)
[q,S,u] = polyfit (a,y,n)

Description

q = polyfit(a,y,n) returns the coefficients for a polynomial q(a) of degree n that is the best fit (in a least-squares sense) for the data in y. The coefficients in q are in descending powers, and the length of q is n+1.

Start Your Free Data Science Course

Hadoop, Data Science, Statistics & others

All in One Data Science Bundle(360+ Courses, 50+ projects)
Python TutorialMachine LearningAWSArtificial Intelligence
TableauR ProgrammingPowerBIDeep Learning
Price
View Courses
360+ Online Courses | 50+ projects | 1500+ Hours | Verifiable Certificates | Lifetime Access
4.7 (86,408 ratings)
[q,S] = polyfit(a,y,n) also returns a structure S they can be used as an input to the polyval to obtain error estimates.

[q,S,u] = polyfit(a,y,n) also returns u and in which here a two-element vector with centering and scaling values. U (1) is mean(a), and u(2) is std(a). Using these values, polyfitcentrea at zero and scales it to have a unit standard deviation

The Curve Fitting Matlab toolbox provides a one-term and a two-term exponential model. The exponential curve is obtained when the rate of change of a quantity is proportional to the initial amount of the quantity. If the coefficient associated with an ax and/or yz is negative, q represents exponential decay. If the coefficient is positive, q represents exponential growth.

Examples of Curve Fitting Matlab

Here are the following examples mention below:

Example #1

Consider the example of a polynomial curve in which we can see how to use polynomial entities in the form of the curve.   variable = polyfit(var1,var2,n),Where var1  and var2 are co-ordinates of two vectors

Code:

ax = [1 2 3 4 4.9];
y = [5.5 43.1 128 290.7 498.4];
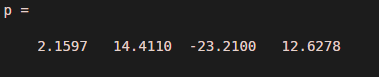
p = polyfit(ax,y,3)
x2 = 1:.1:5;
y2 = polyval(p,x2);
plot(ax,y,'o',x2,y2)
grid on
s = sprintf('y = (%.1f) x^3 + (%.1f) x^2 + (%.1f) x + (%.1f)',p(1),p(2),p(3),p(4));
text(2,400,s)

Output:

curve fitting Matlab output 1

curve fitting Matlab output 1.1

Example #2

Consider 2nd` no.  example of a polynomial curve, in which the polyfit syntax is used.

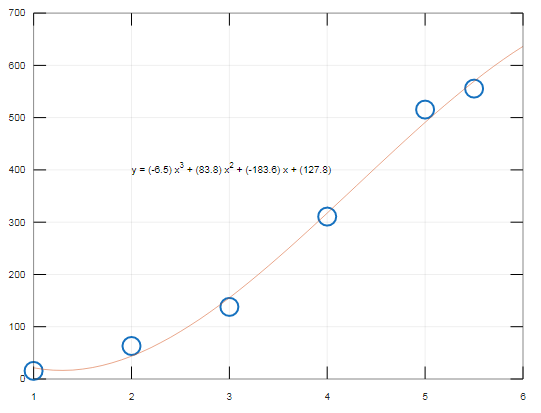
In the below example 6 points curve is shown .in which how to draw the polynomial curve is shown in a simple manner using polyfit syntax. Also the Output is given below the program.

Code:

ax = [1 2 3 4 5 5.5];
y = [15.5 63.1 138 310.7 515.4 555.56];
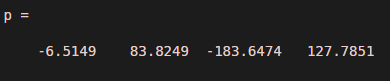
p = polyfit(ax,y,3)
x2 = 1:.1:6;
y2 = polyval(p,x2);
plot(ax,y,'o',x2,y2)
grid on
s = sprintf('y = (%.1f) x^3 + (%.1f) x^2 + (%.1f) x + (%.1f)',p(1),p(2),p(3),p(4));
text(2,400,s)

Output:

curve fitting Matlab output 2

output 2.1

Example #3

Consider 3rd` no.  example of the polynomial curve, in which  the polyfit syntax is used

Also. Polyval Matlab in build function is used

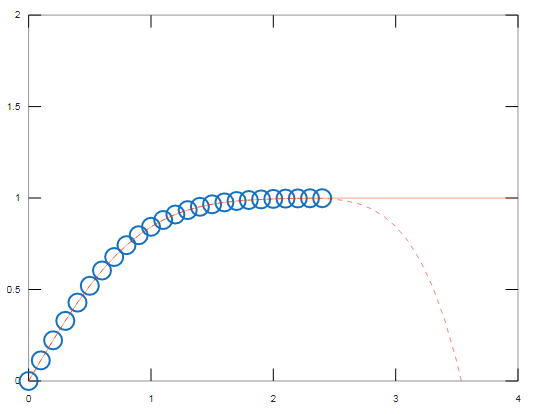
In the below example, the exponential curve is shown .in which how to draw the polynomial curve is shown in a simple manner using polyfit syntax. Also the Output is given below the program.

Code:

ax = (0:0.1:2.4)';
yz = erf(ax);
p = polyfit(ax,yz,5);
f = polyval(p,ax);
T = table(ax,yz,f,yz-f,'VariableNames',{'X','Y','Fit','FitError'});
x1 = (0:0.1:5)';
y1 = erf(x1);
f1 = polyval(p,x1);
figure
plot(ax,yz,'o')
hold on
plot(x1,y1,'-')
plot(x1,f1,'r--')
axis([0  4  0  2])
hold off

Output:

output 3

Conclusion

In this article we have seen how to use Curve fitting, also known as regression analysis,  Curve fitting is used to find the “best fit” line or curve for a series of data points. curve fitting mostly creates an equation that is used to find coordinates along the path, you may not be concerned about finding an equation.

Recommended Articles

This is a guide to Curve Fitting Matlab. Here we discuss how to use Curve fitting in Matlab with respective programming examples for understanding better. You may also have a look at the following articles to learn more –

  1. MATLAB Indexing
  2. Optimset Matlab
  3. MATLAB Derivative of Function
  4. Covariance in Matlab
Popular Course in this category
MATLAB Training (3 Courses, 1 Project)
  3 Online Courses |  1 Hands-on Project |  8+ Hours |  Verifiable Certificate of Completion
4.5
Price

View Course

Related Courses

R Programming Training (13 Courses, 20+ Projects)4.9
All in One Data Science Bundle (360+ Courses, 50+ projects)4.8
1 Shares
Share
Tweet
Share
Primary Sidebar
Footer
About Us
  • Blog
  • Who is EDUCBA?
  • Sign Up
  • Live Classes
  • Corporate Training
  • Certificate from Top Institutions
  • Contact Us
  • Verifiable Certificate
  • Reviews
  • Terms and Conditions
  • Privacy Policy
  •  
Apps
  • iPhone & iPad
  • Android
Resources
  • Free Courses
  • Database Management
  • Machine Learning
  • All Tutorials
Certification Courses
  • All Courses
  • Data Science Course - All in One Bundle
  • Machine Learning Course
  • Hadoop Certification Training
  • Cloud Computing Training Course
  • R Programming Course
  • AWS Training Course
  • SAS Training Course

ISO 10004:2018 & ISO 9001:2015 Certified

© 2022 - EDUCBA. ALL RIGHTS RESERVED. THE CERTIFICATION NAMES ARE THE TRADEMARKS OF THEIR RESPECTIVE OWNERS.

EDUCBA
Free Data Science Course

SPSS, Data visualization with Python, Matplotlib Library, Seaborn Package

*Please provide your correct email id. Login details for this Free course will be emailed to you

By signing up, you agree to our Terms of Use and Privacy Policy.

EDUCBA Login

Forgot Password?

By signing up, you agree to our Terms of Use and Privacy Policy.

EDUCBA
Free Data Science Course

Hadoop, Data Science, Statistics & others

*Please provide your correct email id. Login details for this Free course will be emailed to you

By signing up, you agree to our Terms of Use and Privacy Policy.

EDUCBA

*Please provide your correct email id. Login details for this Free course will be emailed to you

By signing up, you agree to our Terms of Use and Privacy Policy.

Let’s Get Started

By signing up, you agree to our Terms of Use and Privacy Policy.

This website or its third-party tools use cookies, which are necessary to its functioning and required to achieve the purposes illustrated in the cookie policy. By closing this banner, scrolling this page, clicking a link or continuing to browse otherwise, you agree to our Privacy Policy

Loading . . .
Quiz
Question:

Answer:

Quiz Result
Total QuestionsCorrect AnswersWrong AnswersPercentage

Explore 1000+ varieties of Mock tests View more