Updated March 24, 2023
Introduction to Contour Plot in Matlab
Plots are the ways of explaining the results graphically without much detail in the technical front of any subject. There are many types of plots that are used in Matlab for various purposes according to the defined business requirements. Contour plots are used to display the three-dimensional figures in a two-dimensional surface with the help of variables and the input arguments that we provide. They help us to see the graph properly with various properties that can be set manually with the help of different labels in the input arguments. In this topic, we are going to learn about the Contour plot in Matlab.
Working of Contour Plot in Matlab with Syntax
Contour plots are one of the main plots which are used to display the three-dimension figures.
They have different syntaxes which are used in Matlab like:
- contour(X): This is used to draw a contour plot where X contains the values of the height which are defined in the two dimensional(x-y) plane. The row and column values of X are the respective coordinates which are used in the plane.
- contour (a, b, X): This is used to define all the coordinates of a and b for the respective values in X.
- contour(___, levels of the contour lines): Levels of the contour lines can be set by deciding the height of the contour lines to display them at a particular height, which can be defined by any value.
- contour(___, Line Style Property): This syntax can be used to change the properties of the line which includes line color and size of the line which can be customized by giving the values.
- contour(___, Name of the property, Value of the defined property): This syntax is used to set the name-value pair which is generally used to customize the contour lines by defining it in the argument with the property name and its required value.
X defined in the first syntax should be matrix and it should have at least two rows and columns with the defined values in them. The data types that are supported by the matrix are double, single, int8, int32, int16, uint8, uint16, uint32, etc. a and b coordinates defined can be a matrix or a vector but they should have the same size as given in X matrix. The property that is used to store coordinates in the x plane is XData and the property that is used to store b coordinates in the Y plane is YData. Meshgrid property in Matlab is used to create a matrix defined in the values of a and b coordinates.
Examples of Contour plot in Matlab
Please find the below example to see the commands used in displaying contour lines:
Example #1
a= linspace(-3*pi,3*pi);

b = linspace(0,2*pi);

[a,b] = meshgrid(a,b);

C= cos(a)+sin(b);

contour(a,b,C)
Output:
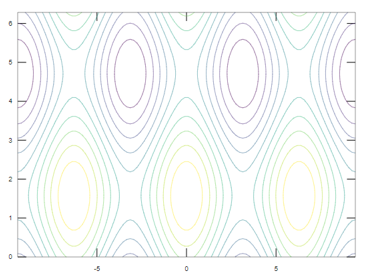
In the above plot, you can see the contour lines which are plotted against the input arguments that we have given. There are various properties of contour lines that are used in customizing the contour lines with the various values.
Please find the below properties that are used:
- If we want to fill the spaces that are present in between the contour lines, then we can use the Fill property in Matlab. It can be set to ON or OFF depending on the requirements. If we want to fill any color between the contour lines in the plot, then we have to set the property to ON and it is considered as the default property when we use contourf function to plot the graph. If we set the property to OFF, then there will be no filling of colors between the contour lines and this is considered as the default property when we use contour3 or contour function to plot the graph.
- We can also change the properties of the line by specifying its color, style, and width of the line. Line color can be changed to red, green, blue, cyan, magenta, black, white, none with the help of ‘LineColor’ property in Matlab. Each color has its own predefined unique RGB value and the value defines the intensity of each color. We can also change the shape of the contour lines with the help of ‘LineStyle’ property. They can be ‘— ‘for dashed line,’: ‘dotted line,’- ‘for a solid line,’-.’ for dash-dotted line and the solid line being the default line style. We can also customize the line width of the contour lines with the help of ‘LineWidth’ property in Matlab. They can be set to any positive value,0.5 is the default value.
Please find the below example which explains the above properties:
Example #2
a= linspace(-3*pi,3*pi);

b = linspace(0,2*pi);

[a,b] = meshgrid(a,b);

C= cos(a)+sin(b);

contour(a,b,C,'LineColor','green')
Output:
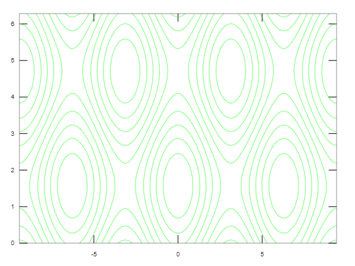
In the above plot, we have set the line color property as green so, the contour lines are displayed in green color. We can also change the line width similarly by setting any positive value to it.
Example #3
a= linspace(-3*pi,3*pi);
b = linspace(0,2*pi);
[a,b] = meshgrid(a,b);
C= cos(a)+sin(b);
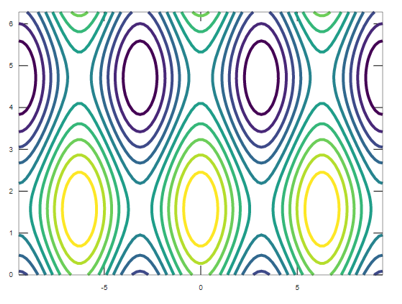
contour(a,b,C,'LineWidth',4)
Output:
- One of the most important properties of the contour lines is to set the height of the contour lines with the help of peaks function in Matlab. We can choose any scalar value in the input argument to indicate the height of the lines. Please find the below example which marks the height of the contour lines with the help of peaks function:
Example #4
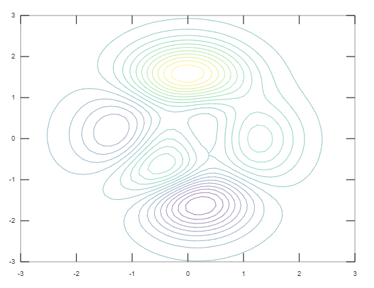
[a,b,C] = peaks;

contour(a,b,C,20)
Output:
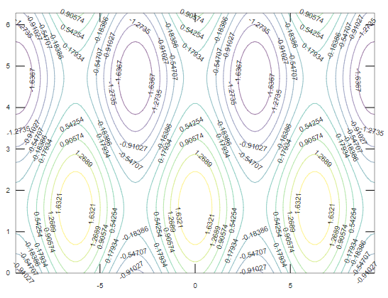
- We can also display the values in the contour lines by using ‘ShowText’ property which should be set to ‘ON’. Please find the below example depicting the current property:
Example #5
a= linspace(-3*pi,3*pi);

b = linspace(0,2*pi);

[a,b] = meshgrid(a,b);

C= cos(a)+sin(b);

contour(a,b,C,'ShowText','on')
Output:
Conclusion
Contour lines are used for many purposes like to identify the location of any place or to decide the storage capacity. They are mainly used in topographic maps to show the various levels with respect to water and ground. They have many properties that can be used depending on the business requirements or choice of the users.
Recommended Articles
This is a guide to the Contour plot in Matlab. Here we discuss the examples to see the commands used in displaying contour lines. You may also have a look at the following articles to learn more –
