Updated June 23, 2023
Introduction to Bandpass Filter Matlab
Band-pass filters are electronic circuits or devices that engineers use to filter or isolate certain frequencies within a particular range. These filters find applications in various systems, such as audio amplifiers, loudspeakers (crossover filters), and pre-amplifiers for tone controls. In such applications, engineers need to pass only a specific range of frequencies, which does not start at DC (0 Hz) or extend to higher frequencies but lies within a particular range, which can be either wide or narrow.
Syntax:
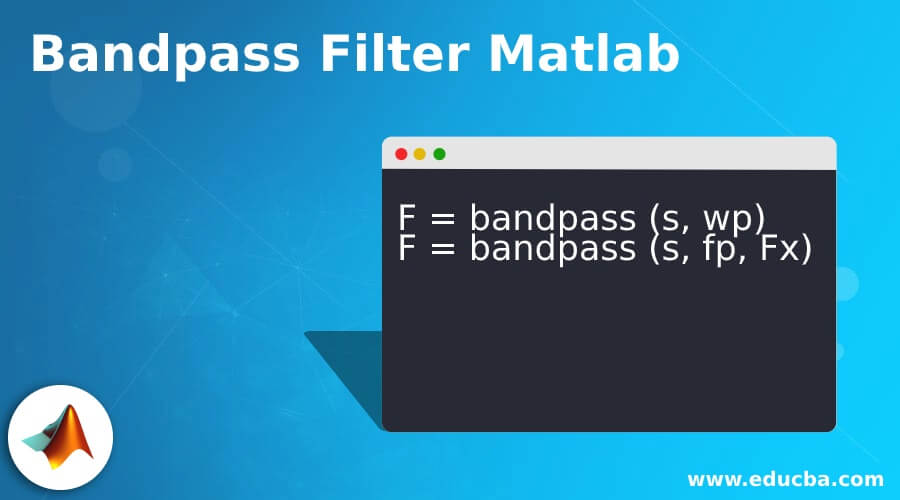
F = bandpass (s, wp)
F = bandpass (s, fp, Fx)
Description:
- F = bandpass(s, wp) filters the signal ‘s’ with passband frequency range provided by the 2-element vector ‘wp.’ If input ‘s’ is a matrix, the bandpass function will filter each column of ‘s’ independently.
- F = bandpass (s, fp, Fx) is used to specify that the signal ‘s’ is sampled at a rate ‘Fx’ HZ. The 2-element vector ‘fp’ gives the passband frequency.
Examples of Bandpass Filter Matlab
Let us now understand the code of ‘Bandpass filter’ in MATLAB with the help of various examples:
Example #1
In this example, we will create a sine signal which is sampled at 10000Hz for 1 second and will pass it through a Bandpass filter.
Below are the steps to be followed:
- Define the sampling rate.
- Define the tones for the signal.
- Keep low-frequency and high-frequency tones at a level of three times the intermediate tone.
- Pass the above signal through the bandpass filter by setting the allowed frequencies.
Code:
Fx = 1e4

T = 0:1/Fx:1
s = [3 1 3]*sin(pi*[50 100 300]'.*T) + randn(size(T))/20;
bandpass(s, [100 200], Fx)
Input:
Fx = 1e4

T = 0:1/Fx:1

s = [3 1 3]*sin(pi*[50 100 300]'.*T) + randn(size(T))/20;

bandpass(s, [100 200], Fx)
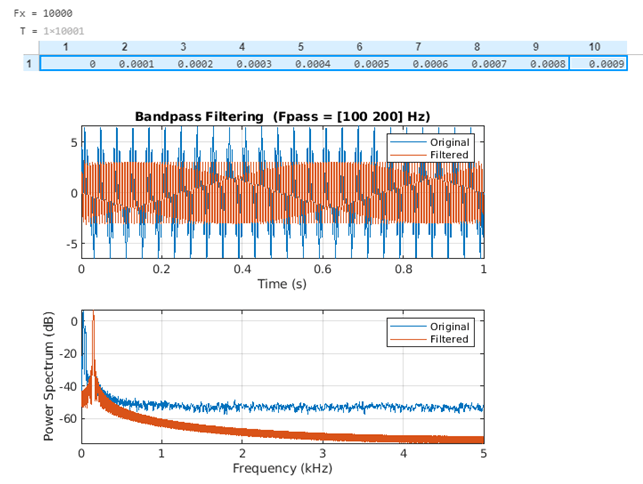
Output:
As we can see in the output, we have obtained the original & filtered signals along with their spectra. The Bandpass filter has removed the frequencies below the low pass frequency and frequencies above the high pass frequency.
Example #2
In this example, we will create a cos signal which is sampled at 10000Hz for 1 second and will pass it through a Bandpass filter.
Below are the steps to be followed:
- Define the sampling rate.
- Define the tones for the signal.
- Keep low-frequency and high-frequency tones at a level of two times the intermediate tone.
- Pass the above signal through the bandpass filter by setting the allowed frequencies.
Code:
Fx = 1e4

T = 0:1/Fx:1
s = [2 1 2]*cos(pi*[150 200 300]'.*T) + randn(size(T))/20;
bandpass(s, [100 200], Fx)
Input:
Fx = 1e4

T = 0:1/Fx:1

s = [2 1 2]*cos(pi*[150 200 300]'.*T) + randn(size(T))/20;

bandpass(s, [100 200], Fx)
Output:
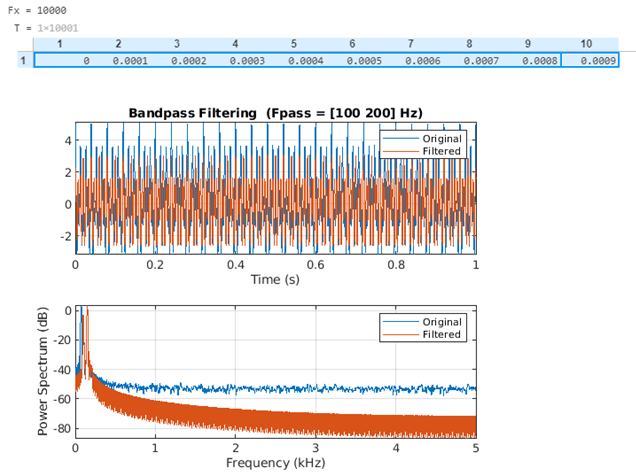
As we can see in the output, we have obtained the original & filtered signals for our input cos signal along with their spectra. The Bandpass filter has removed the frequencies below the low pass frequency and frequencies above the high pass frequency.
Example #3
In the above 2 examples, we used a three-channel signal; in this example, we will use a 2-channel signal and pass it through a Bandpass filter.
- Define the sampling rate.
- Define the tones for the signal.
- Keep the high frequency twice the low frequency.
- Pass the above signal through the bandpass filter by setting the allowed frequencies.
Code:
Fx = 1e4

T = 0:1/Fx:1
s = [2 1].*cos(2*pi*(0:64)'./[32 64])
bandpass(s, [100 200], Fx)
Input:
Fx = 1e4

T = 0:1/Fx:1

s = [2 1].*cos(2*pi*(0:64)'./[32 64])

bandpass(s, [100 200], Fx)
Output:
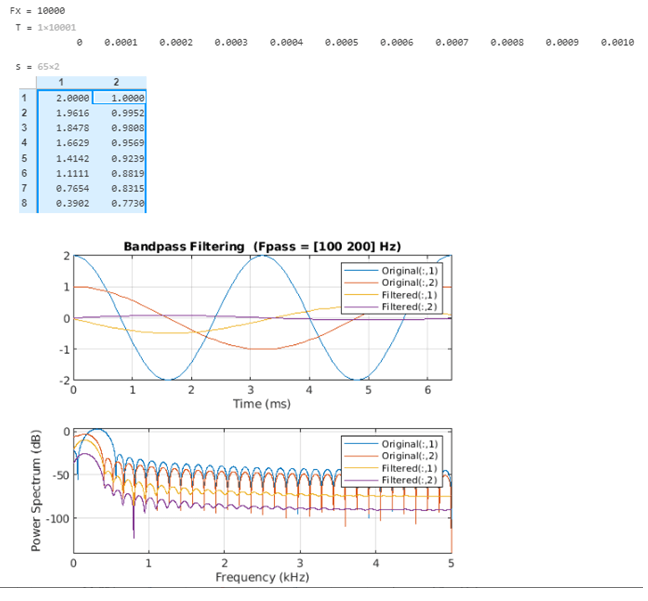
As we can see in the output, we have obtained the original & filtered signals for our input cos signal along with their spectra. The Bandpass filter has removed the frequencies below the low pass frequency and frequencies above the high pass frequency.
Conclusion
- We use the Bandpass function in MATLAB to execute a Bandpass filter.
- The Bandpass function in MATLAB provides both original and filtered signals as output.
- This function also provides the spectra of the signals in the output.
Recommended Articles
This is a guide to Bandpass Filter Matlab. Here we also discuss the introduction and syntax of bandpass filter matlab along with a different example and its code implementation. You may also have a look at the following articles to learn more –
