
Introduction to Matlab Sine Wave
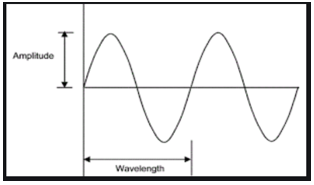
Sine wave, also known as a sinusoidal wave, is a mathematical expression that represents a repetitive oscillation. It is a function of time. MATLAB supports generating sin waves using the 2D plot function. In this topic, we are going to learn about Matlab Sine Wave.
The general syntax for a sinusoidal input can be given as:
s(t)= A(sinBt+C)
The sine wave plot for s(t) is generated using the plot() function as :
plot(s(t),t)
Where ‘A’ decides the peak value of the wave i.e. the amplitude.
Example:
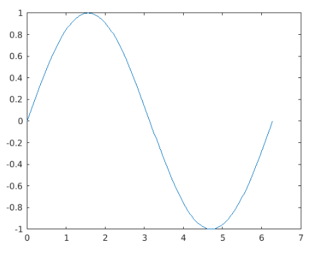
The below code is written to generate sin wave with an amplitude of value ‘1’.
t = 0:pi/100:2*pi;

st = sin(t);

plot(t,st)
Output:
In real-time applications, the sinewave inputs are formed as
Asin(w*t+theta)
or
Asin(2*pi*f*t+theta)
Where:
| w | Decides the angular frequency of the wave |
| Theta | Decides the phase angle for the frequency |
| f | Decides the linear frequency of the wave |
Note: Angular frequency w and linear frequency f are related as
w=2*pi*f
Examples of Matlab Sine Wave
Here are the following examples mention below:
Example #1
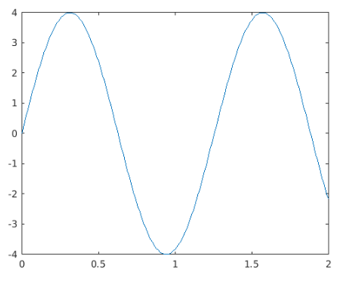
The below code is developed to generate sin wave having values for amplitude as ‘4’ and angular frequency as ‘5’.
t = 0:0.01:2;

w = 5;

a = 4;

st = a*sin(w*t);

plot(t,st);
Output:
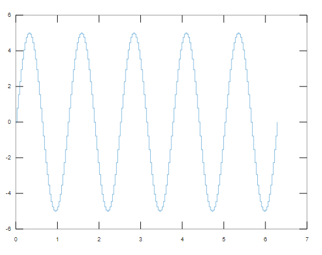
The resultant sine wave is displayed for the time duration of 0 to 2 attaining the peak amplitude +4 in the first half cycle and -4 in the second half cycle with angular frequency 5.
Example #2
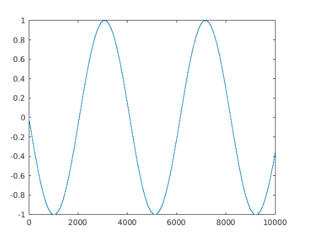
The below code is developed to generate sin wave having values for amplitude as ‘1’ and liner frequency as ‘10’.
f = 10;

t = 0:0.1:10000;

st = sin(2*3.141516*f*t);

plot(t,st);
Output:
The resultant sine wave is displayed for the time duration of 0 to 10000 attaining the peak amplitude +1 in the first half cycle and -1 in the second half cycle having linear frequency 10.
MATLAB incorporates the flexibility of customizing the sine wave graph. It can be achieved by editing the attributes for plot() function.
- xlabel: x-axis label is generated.
- Ylabel: y-axis label is generated.
- Title: A title gets added to the sine wave plot
- Axis square: It enables the user to generate the sine wave in square form.
- Axis equal: User can create the sine wave plot with common scale factor and spaces for both the axes
- Grid on: gridlines gets enabled for the sine wave plot
Example:
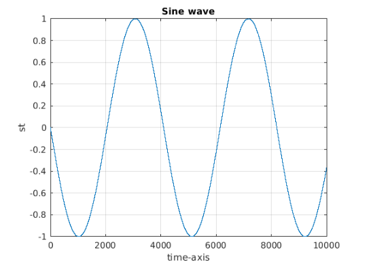
The below code is developed to generate sin wave having values for amplitude as ‘1’ and liner frequency as ‘10’.
f = 10;

t = 0:0.1:10000;

st = sin(2*3.141516*f*t);

plot(t,st), xlabel('time-axis'), ylabel('st'), title('Sine wave'),

grid on
Output:
The resultant sine wave is displayed for the time duration of 0 to 10000 attaining the peak amplitude +1 in the first half cycle and -1 in the second half cycle having linear frequency 10. The plot is customized by inserting values for xlabel and ylabel and title of the plot.
Generating multiple sine wave plots with different pair of axes
The feature of generating the multiple numbers of sinusoidal plots with different pairs of axes in the same layout using a single command can be applied using ‘subplot’.
Example:
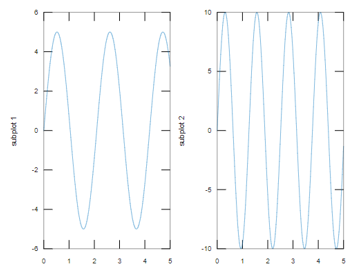
The below code is developed to generate 2 sin waves having values for amplitude as 5 and 10 respectively and angular frequency as 3 and 5 respectively.
t = [0:0.01:5];

st = 5*sin(3*t);

subplot(1,2,1)

plot(x,y), xlabel('t'),ylabel('subplot 1')

st = 10*sin(5*t);

subplot(1,2,2)

plot(x,y),xlabel('t'),ylabel('subplot 2')
Output:
The resultant graph contains two different sinusoidal plots created in the same layout. The first sinusoidal wave is generated in the first cell of the layout with an amplitude of 5 and an angular frequency of 3. The second sinusoidal wave with an amplitude of 10 and an angular frequency of 5 is generated in the second cell of the layout.
1. Presenting multiple sine waves with a common axis
Displaying multiple sine waves sharing one set of the common axis is also supported by MATLAB. This can be achieved in a single command as shown in the example given below.
Example:
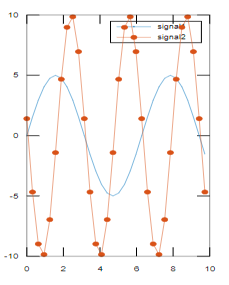
The code snippet is written to display 2 different sine waves on one common plane sharing a single pair of axes.
t = [0 :pi/10: 10];

st1 = 5*sin(t);

st2 = 10*sin(2*t+3);

plot(t,st1,t,st2,'.-'), legend('signal1', 'signal2')
Output:
The resultant graph contains one sinusoidal wave having amplitude 5 and angular frequency 1 and another sine wave having an amplitude of 10, angular frequency of 2, and a phase shift of 3.
2. Creating an area plot for sinewave function
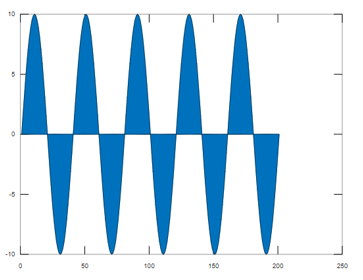
The MATLAB 2d plot method area() can be used to represent the input sine wave with the area under the curves being filled. The curve at the nth interval of the time axis, represents the relative share of each input element concerning the total height of the curved.
Example:
The below code generates an area type plot for the given sinusoidal wave input.
t=[0:pi/100:2*pi];st=10*sin(5*t);area(st)
Output:
3. Creating a scatter plot for sinewave function
The MATLAB 2d plot method scatter() can be used to represent the input sine wave data points as small circles concerning the value on the ‘t’ axis.
Example:
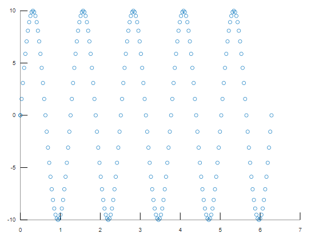
t=[0:pi/100:2*pi];st=10*sin(5*t);scatter(t,st)
Output:
4. Creating a stair plot for sinewave function
The MATLAB 2d plot method stairs() can be used to represent the input sine wave in the form of stairs drawn over the ‘t’ axis.
Example:
t=[0:pi/100:2*pi];st=5*sin(5*t);stairs(t,st)
Output:
5. Generating sine wave for real-time application simulation
MATLAB is used to run simulation activities of real-time applications. Most of the signals from the applications are sinusoidal by nature. Hence generating a sine wave using MATLAB plays an important role in the simulation feature of MATLAB.
Example:
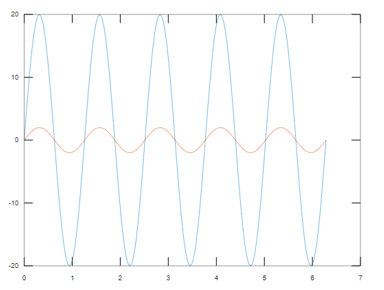
The electrical voltage and current through a register are related as
Current i= voltage(v)/Registance(r)
The below example demonstrates the extraction of the current value from the voltage input and represents both the signals.
t = 0:pi/100:2*pi;r=10;v=20*sin(5*t);i=v./r;plot(t,v,t,i)
Output:
Conclusion
The generation of sine wave signals using plot function is one of the key features in MATLAB which enables it to run a simulation process for many real-time functions accurately and precisely. The flexibility in customization of the display of sine waves is a major add-on to its applicability.
Recommended Articles
This is a guide to Matlab Sine Wave. Here we discuss the generating multiple sine wave plots with different pairs of axes along with the sample examples. You may also have a look at the following articles to learn more –
