Updated March 20, 2023
Introduction to ANOVA in R
ANOVA in R is a mechanism facilitated by R programming to carry out the implementation of the statistical concept of ANOVA, i.e. analysis of variance, a technique that allows the user to check if the mean of a particular metric across a various population is equal or not, through the formulation of the null and alternative hypothesis, with R programming providing effective functionalities to implement the concept through various functions and packages.
Why ANOVA?
- This technique is used to answer the hypothesis while analyzing multiple groups of data. There are multiple statistical approaches; however, the ANOVA in R is applied when comparison needs to be done on more than two independent groups, as in our previous example, three different age groups.
- ANOVA technique measures the mean of the independent groups to provide researchers with the result of the hypothesis. In order to get accurate results, sample means, sample size, and standard deviation from each individual group must be taken into account.
- It is possible to observe the mean individually for each of the three groups for comparison. However, this approach has limitations and may prove incorrect because these three comparisons don’t consider total data and thus may lead to type 1 error. R provides us with the function to conduct the ANOVA analysis to examine variability among the independent groups of data. There are five stages of conducting the ANOVA analysis. In the first stage, data is arranged in csv format, and the column is generated for each variable. One of the columns would be a dependent variable, and the remaining is the independent variable. In the second stage, the data is read in R studio and named appropriately. In the third stage, a dataset is attached to individual variables and read by the memory. Finally, the ANOVA in R is defined and analyzed. In the below sections, I’ve provided a couple of case study examples in which ANOVA techniques should be used.
- Six insecticides were tested on 12 fields each, and the researchers counted the number of bugs that remained in each field. Now the farmers need to know if the insecticides make any difference and which one they best use. You answer this question by using the aov() function to perform an ANOVA.
- Fifty patients received one of five cholesterol-reducing drug treatments (trt). Three of the treatment conditions involved the same drug administered as 20 mg once per day (1 time), 10mg twice per day (2 times) 5 mg four times per day (4 times). The two remaining conditions (drugD and drugE) represented competing drugs. Which drug treatment produced the greatest cholesterol reduction (response)?
ANOVA One-Way in R
- The one-way method is one of the basis ANOVA technique in which variance analysis is applied, and the mean value of multiple population groups is compared.
- One-way ANOVA got its name because of the availability of one-way classified data. In a one-way ANOVA single dependent variable and one or more independent variables may be available.
- For example, we will perform the ANOVA technique on the cholesterol dataset. The dataset consists of two variables trt ( which are treatments at 5 different levels) and response variables. Independent variable – groups of drug treatment, dependent variable – means of 2 or more groups ANOVA. From these results, you can confirm taking the 5 mg doses 4 times a day was better than taking a twenty mg dose once a day. Drug D has better effects when compared to that drug E.
Drug D provides better results if taken in 20 mg doses compared to drug E,
Uses cholesterol dataset in the multcomp package.
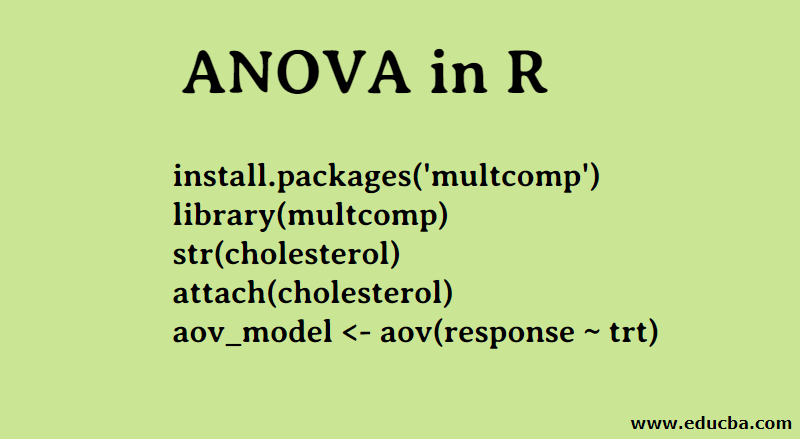
Code:
install.packages('multcomp')

library(multcomp)

str(cholesterol)

attach(cholesterol)

aov_model <- aov(response ~ trt)
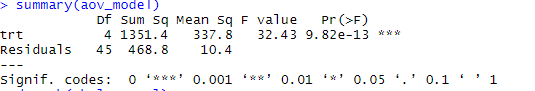
The ANOVA F test for treatment (trt) is significant (p < .0001), providing evidence that the five treatments aren’t all equally effective.
summary(aov_model)
detach(cholesterol)
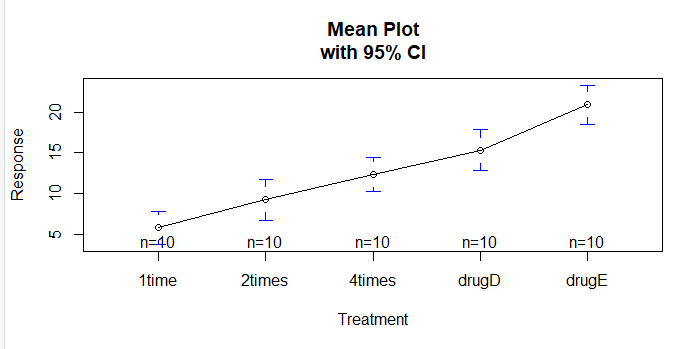
The plotmeans() function in the gplots package can be used to produce a graph of group means and their confidence intervals. This clearly shows treatment differences.
Code:
install.packages('gplots')

library(gplots)

plotmeans(response ~ trt, xlab="Treatment", ylab="Response",

main="Mean Plot\nwith 95% CI")
Output:
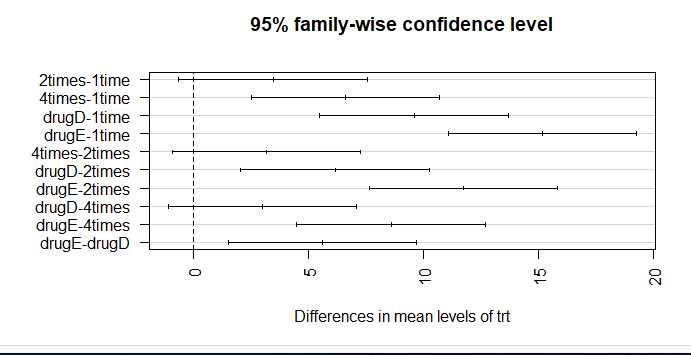
Let’s examine the output from TukeyHSD() for pairwise differences between group means.
TukeyHSD(aov_model)
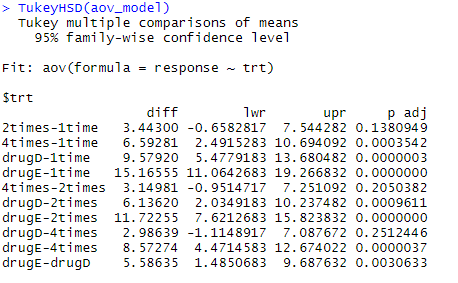
The mean cholesterol reductions for 1 time and 2 times aren’t significantly different from each other (p = 0.138), whereas the difference between 1 time and 4 times is significantly different (p < .001).
par(mar=c(5,8,4,2)) # increase left margin plot(TukeyHSD(aov_model), las = 2)
Confidence in results depends on the degree to which your data satisfies the assumptions underlying the statistical tests. In a one-way ANOVA, the dependent variable is assumed to be normally distributed and have equal variance in each group. You can use a Q-Q plot to assess the normality assumption library(car).
Q-Q plot(lm(response ~ trt, data=cholesterol), simulate=TRUE, main=”Q-Q Plot”, labels=FALSE)
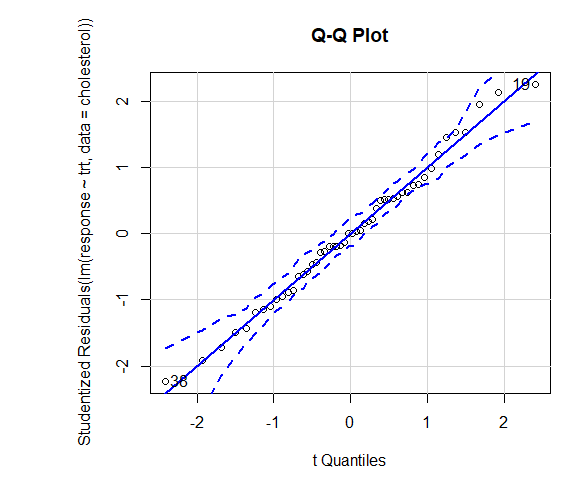
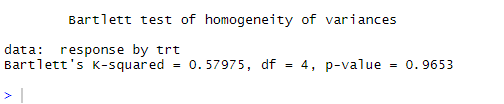
Dotted line = 95% confidence envelope, suggesting that the normality assumption has been met fairly well ANOVA assumes that variances are equal across groups or samples. The Bartlett test can be used to verify that assumption
bartlett.test(response ~ trt, data=cholesterol). Bartlett’s test indicates that the variances in the five groups don’t differ significantly (p = 0.97).
ANOVA is also sensitive to outliers test for outliers using the outlierTest() function in the car package. You may not need to run this package to update your car library.
update.packages(checkBuilt = TRUE)

install.packages("car", dependencies = TRUE)

library(car)

outlierTest(aov_model)

From the output, you can see that there’s no indication of outliers in the cholesterol data (NA occurs when p > 1). Taking the Q-Q plot, Bartlett’s test, and outlier test together, the data appear to fit the ANOVA model quite well.
Two-Way Anova in R
Another variable is added in the Two-way ANOVA test. When there are two independent variables, we will need to use two-way ANOVA rather than the one-way ANOVA technique used in the previous case where we had one continuous dependent variable and more than one independent variable. In order to verify two-way ANOVA, multiple assumptions need to be satisfied.
- Availability of independent observations
- Observations should be normally distributed
- Variance should be equal in observations
- Outliers should not be present
- Independent errors
To verify the two-way ANOVA, another variable called BP is added to the dataset. The variable indicates the rate of blood pressure in patients. We would like to verify if there is any statistical difference between BP and dosage given to the patients.
df <- read.csv(“file.csv”)
df
anova_two_way <- aov(response ~ trt + BP, data = df)
summary(anova_two_way)
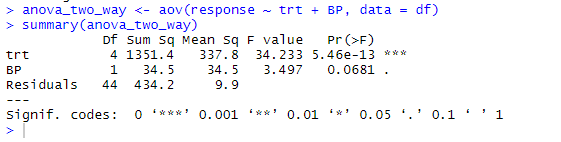
From the output, it can be concluded that both the trt and BP are statistically different from 0. Hence, the Null hypothesis can be rejected.
Benefits of ANOVA in R
- ANOVA test determines the difference in mean between two or more independent groups. This technique is very useful for multiple items analysis which is essential for market analysis. Using the ANOVA test, one can get necessary insights from the data.
- For example, during a product survey where multiple information such as shopping lists, customer likes, and dislikes are collected from the users.
- The ANOVA test helps us to compare groups of the population. The group could either be Male vs Female or various age groups. ANOVA technique helps in distinguish between the mean values of different groups of the population, which are indeed different.
Conclusion
ANOVA is one of the most commonly used methods for hypothesis testing. This article has performed an ANOVA test on the data set consisting of fifty patients who received cholesterol-reducing drug treatment and have further seen how two-way ANOVA can be performed when an additional independent variable is available.
Recommended Articles
This is a guide to ANOVA in R. Here we discuss the one-way and two-way Anova model along with respective examples and benefits of ANOVA. You can also go through our other suggested articles to learn more –
