
What is Capital Market Line?
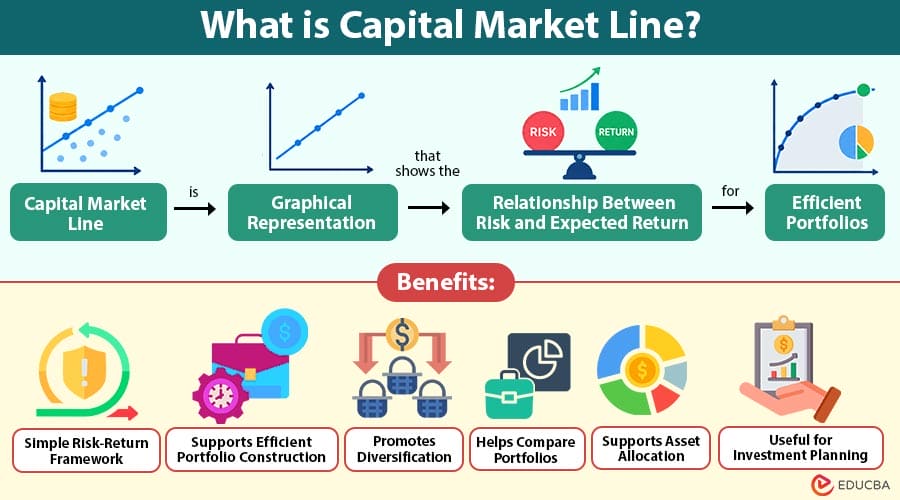
The Capital Market Line (CML) is graphical representation that shows the relationship between risk and expected return for efficient portfolios. It is an important concept in modern portfolio theory and is associated with the Capital Asset Pricing Model (CAPM).
The CML connects the risk-free rate with the market portfolio. It shows how an investor can combine a risk-free asset with a diversified market portfolio to achieve different levels of risk and expected return.
On a graph, portfolio risk is generally shown on the horizontal axis, while expected return is shown on the vertical axis. The CML is a straight line that begins at the risk-free rate and rises toward the expected return of the market portfolio. The slope of the CML represents the market price of risk, which indicates the additional return an investor expects for taking an additional unit of risk.
Table of Contents:
Key Takeaways:
- The capital market line shows the relationship between expected return and total risk for efficient portfolios.
- It connects the risk-free rate with the market portfolio to guide investment allocation decisions.
- The capital market line formula helps estimate expected portfolio returns based on standard deviation and market returns.
- Investors should consider the capital market line assumptions and changing market conditions when applying it to investment decisions.
Importance of Capital Market Line
The capital market line helps investors understand how risk and return are connected when constructing efficient portfolios. It provides a framework for selecting portfolios based on an investor’s risk tolerance.
Below are the major reasons why the CML is important:
1. Helps Measure Risk and Return
The CML illustrates the expected return available for different levels of portfolio risk. Investors can use it to compare investment choices based on their desired risk level.
2. Supports Portfolio Selection
Investors can identify efficient portfolios that offer the highest expected return for a particular level of risk. Portfolios below the CML are generally considered inefficient.
3. Encourages Diversification
The CML is based on combining a risk-free asset with a well-diversified market portfolio. This highlights the importance of diversification in managing investment risk.
4. Helps Understand Investor Choices
Different combinations of risk-free investments and the market portfolio are available to investors with varying risk tolerances. Aggressive investors might accept more market exposure, while conservative investors might put more money into the risk-free asset.
5. Supports Financial Decision-Making
Portfolio managers can use the relationship shown by the CML to evaluate investment strategies and determine suitable portfolio allocations.
Capital Market Line Formula
The formula for the Capital Market Line is:
Where:
- E(Rp) = Expected return of the portfolio
- Rf = Risk-free rate
- E(Rm) = Expected return of market portfolio
- σm = Standard deviation of the market portfolio
- σp = Standard deviation of the portfolio
The term [(E(Rm) − Rf) / σm] represents the slope of the CML.
This slope is also called the market portfolio’s Sharpe ratio. It measures the excess return generated for each unit of total portfolio risk.
How Does the Capital Market Line Work?
The Capital Market Line shows combinations of a risk-free asset and the market portfolio.
An investor can invest entirely in the risk-free asset, entirely in the market portfolio, or combine both depending on their risk preference.
For example, a conservative investor may invest a larger portion of their money in a risk-free asset and a smaller portion in the market portfolio. This produces lower portfolio risk and lower expected return.
An investor willing to accept greater risk may invest more in the market portfolio. The expected return increases as the portfolio takes on more market risk.
Investors may also borrow money at the risk-free rate and invest the borrowed amount in the market portfolio. This creates leverage and can produce a portfolio with risk and expected return above the market portfolio, although it also increases potential losses.
The CML therefore provides a range of efficient portfolio combinations.
Components of the Capital Market Line
The capital market line contains several important components.
1. Risk-Free Rate
The risk-free rate represents the return from an investment with negligible default risk, such as certain government securities. It forms the starting point of the CML.
2. Market Portfolio
The market portfolio represents a diversified portfolio containing risky assets available in the market. It is the key risky portfolio used in constructing the CML.
3. Expected Return
Expected return represents the return an investor anticipates receiving from a portfolio over a particular period.
4. Standard Deviation
Standard deviation measures a portfolio’s total risk, or volatility. Higher standard deviation generally indicates greater fluctuations in portfolio returns.
5. Market Price of Risk
The slope of the CML represents the additional expected return earned for each additional unit of risk.
Capital Market Line Example
Suppose the risk-free rate is 5%, the expected market return is 11%, and the market portfolio’s standard deviation is 15%.
An investor creates a portfolio with a standard deviation of 10%.
Using the CML formula:
E(Rp) = 5% + [(11% − 5%) / 15%] × 10%
E(Rp) = 5% + 4% = 9%
Therefore, the portfolio’s expected return would be 9% under these assumptions.
This example shows how the CML can estimate the expected return associated with a particular level of portfolio risk.
Difference Between Capital Market Line and Security Market Line
The table below highlights the differences between the two:
| Basis | Capital Market Line | Security Market Line |
| Focus | Efficient portfolios | Individual securities and portfolios |
| Risk measure | Standard deviation | Beta |
| Return | Expected portfolio return | Expected security or portfolio return |
| Based on | Total risk | Systematic risk |
| Application | Portfolio selection | Security valuation |
Benefits of the Capital Market Line
The Capital Market Line provides several benefits to investors and portfolio managers.
1. Simple Risk-Return Framework
The CML clearly illustrates the relationship between risk and expected return, making portfolio analysis easier for investors to understand.
2. Supports Efficient Portfolio Construction
It helps investors identify portfolios offering the highest expected return for a specific level of total investment risk.
3. Promotes Diversification
The model encourages investors to combine different investments, reducing dependence on individual securities and supporting better overall portfolio diversification.
4. Helps Compare Portfolios
Investors can compare portfolios using expected returns and risk levels, helping them identify inefficient investment combinations more effectively.
5. Supports Asset Allocation
The CML helps investors understand how allocating funds between risk-free assets and the market portfolio influences overall risk.
6. Useful for Investment Planning
Financial professionals can use the CML as a theoretical framework for portfolio construction, investment planning, and effective risk management.
Limitations of the Capital Market Line
Despite its usefulness, the capital market line has several limitations.
1. Depends on Assumptions
The CML is based on assumptions such as rational investors, efficient markets, and the availability of a risk-free borrowing and lending rate. These assumptions may not always hold in real markets.
2. Market Portfolio Is Difficult to Define
The theoretical market portfolio should include all available risky assets. Accurately constructing such a portfolio can be difficult.
3. Returns Are Not Guaranteed
Expected returns calculated using the CML are estimates rather than guaranteed outcomes. Actual investment returns can differ significantly.
4. Borrowing May Not Occur at the Risk-Free Rate
The model assumes investors can borrow and lend at the risk-free rate. In reality, borrowing costs are usually higher than the rate available on risk-free investments.
5. Risk Measurement Can Change
Standard deviation measures overall volatility but does not capture every possible type of investment risk, such as liquidity risk or unexpected market events.
6. Market Conditions Change
Interest rates, asset prices, investor expectations, and economic conditions change over time. Therefore, the inputs used to construct the CML can also change.
Final Thoughts
The Capital Market Line provides useful framework for understanding relationship between risk and expected return for efficient portfolios. By combining risk-free assets with the market portfolio, investors can make informed allocation decisions. However, investors should consider its assumptions and changing market conditions when applying the CML in practice.
Frequently Asked Questions (FAQs)
Q1. What is main purpose of the capital market line?
Answer: The main purpose of the capital market line is to show the expected return available for different levels of total risk in efficient portfolios.
Q2. How is the capital market line calculated?
Answer: The CML is calculated using the risk-free rate, expected market return, market portfolio risk, and the selected portfolio’s standard deviation.
Q3. What does the capital market line tell investors?
Answer: The CML helps investors understand how expected returns change as portfolio risk increases or decreases when combining a risk-free asset with the market portfolio.
Q4. What type of risk does the capital market line measure?
Answer: The CML uses total portfolio risk, which is measured through standard deviation. This includes both systematic and unsystematic risk.
Recommended Articles
We hope that this EDUCBA information on “Capital Market Line” was beneficial to you. You can view EDUCBA’s recommended articles for more information.