


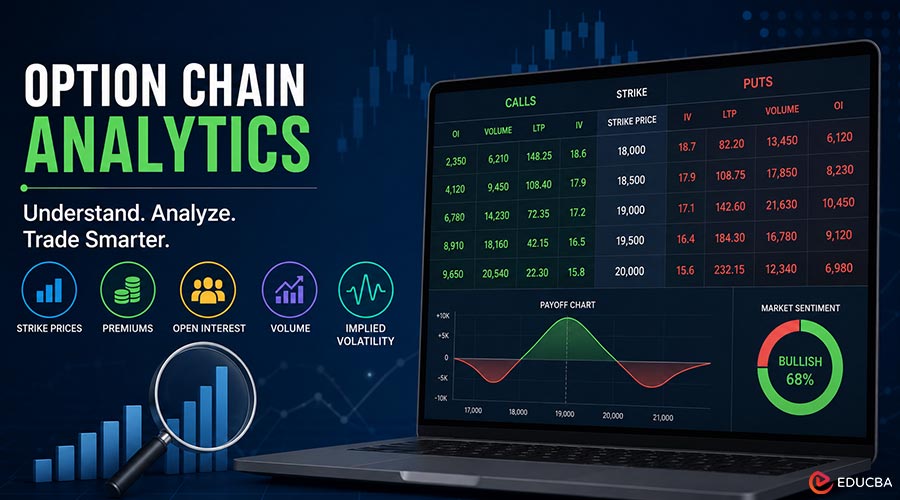
One glance at an option chain can give you plenty of numbers, but numbers alone do not tell you what a trade may mean. Traders need to connect strike prices, premiums, Open Interest (OI), and volume to understand the activity behind a setup.
An app with real-time option chain analytics can help you bring these details together as you assess the market. This allows traders to look beyond individual figures and examine the broader picture before placing a trade.
But how do you read this information effectively? Let’s understand option chain analytics and how to use it better.
Option Chain Analytics: Understanding the Data Behind Options Trading
An option chain gives you a structured view of call and put contracts across strike prices and expiry dates. Traders can study premiums, OI, volume, and Implied Volatility (IV) to understand market activity and compare potential setups.
This data becomes more valuable when connected with trading decisions. An app with real-time option chain analytics can bring analysis, strategy creation, and order placement together. This helps traders move from assessing a setup to executing it more efficiently.
5 Ways Options Trading Apps Can Simplify Option Chain Analytics
You can bring several market analysis and execution tools together through an options trading app. Here are 5 ways you can use these tools for option chain analysis.
1. Execute Popular F&O Strategies with Pre-built Setups
Traders can create and execute popular Futures and Options (F&O) setups using pre-built strategies. These can include Straddle, Strangle, Iron Condor, and many more.
Instead of building every leg manually, traders can start with an existing strategy. This helps traders build setups faster when market conditions change.
2. Discover Opportunities with F&O Screeners and Scanners
Real-time screeners can help identify scrips based on Volume, OI, and other criteria. This can help narrow down potential opportunities.
Scanners can also help monitor scrips based on trends, buildup, IV, and other conditions. This gives you another way to track market activity.
If you are starting, a free trading account can give you an entry point to explore available trading tools and features.
3. Build Trades Around Your Market Outlook
Traders can search for trading ideas that match their market outlook. These ideas can help when you expect the market to move in a particular direction.
Traders can explore opportunities based on bullish, bearish, or neutral views. You can also explore index and stock options opportunities based on your market outlook.
This approach can help you connect your market view with a potential options strategy. Then you can study the setup before deciding whether to proceed.
4. Visualize Potential Outcomes with Real-time Payoff Graphs
Visualizing potential outcomes can make a strategy easier to understand. Payoff graphs can help you examine these possibilities before execution.
Each graph helps traders see a trade’s potential upside and downside. This can give you a clearer understanding of how your strategy may perform.
When you use multiple option legs, visual analysis becomes especially useful. Traders can examine the broader payoff structure before placing an order.
5. Access Advanced Tools for Smarter Strategy Execution
With Quant Mode, you can define your trading logic using nine conditions, including Delta, Gamma, and At-the-Money (ATM) points. This lets traders find strikes that match their strategy without manual effort.
Forever with One Cancels the Other (OCO) can keep entry or exit triggers active for up to one year. This can be useful for predefined price levels.
With Instant Pledge Margin, you can pledge eligible shares to access additional margin for option buying and selling. The Advanced Option Chain also supports direct order placement.
Traders can analyze calls and puts and place orders directly from the option chain. This helps traders avoid switching between separate screens during execution.
Make Better Use of Option Chain Analytics with the Right Trading App
Traders can gain more from an option chain by looking beyond individual strike prices and premiums. By studying multiple data points, they can build a clearer view of market activity.
An app with real-time option chain analytics can give you easier access to this information during market hours. However, traders should still assess the data alongside their trading strategy, risk tolerance, and market outlook.
Traders should avoid treating a single indicator as a complete trading signal. Instead, consider how different indicators work together before deciding.
When you understand the information available through an option chain, you can use it as more than a table of figures. You can turn that data into useful market insight and approach potential trades with greater clarity.
Final Thoughts
Option chain analytics can help you understand market activity by bringing together data such as strike prices, premiums, Open Interest, volume, and Implied Volatility. Instead of relying on a single indicator, you can use these insights to evaluate potential setups and align them with your market outlook.
The right trading app can make this analysis more convenient by providing real-time data, screeners, payoff graphs, strategy tools, and direct order placement. However, analytics should support your decision-making, not replace proper research and risk management. By understanding how different option chain data points work together, you can approach options trading with greater clarity and discipline.
Recommended Articles
We hope this guide on option chain analytics helps you understand options data and make more informed trading decisions. Explore these recommended articles for more insights into options trading, market analysis, and trading strategies.