What Is Tapering in Finance?
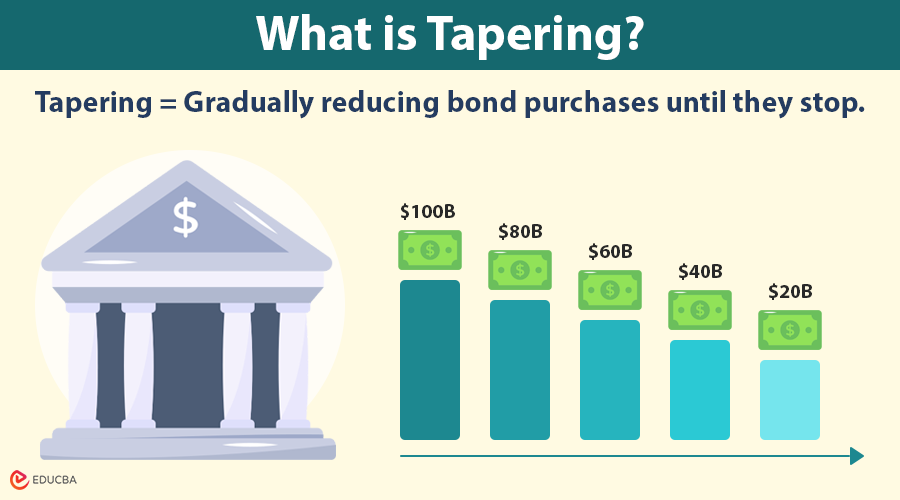
Tapering occurs when a central bank gradually reduces its asset purchases, such as government bonds or mortgage-backed securities, following a period of quantitative easing (QE), indicating a shift toward less supportive monetary policy.
Imagine a central bank buys $100 billion in government bonds every month to help the economy. When it decides to taper, it reduces purchases to $80 billion per month, then to $60 billion, and so on, until it eventually stops buying.
Table of Contents
- What Is Tapering in Finance?
- How Does it Differ from Related Moves?
- Transmission Channels
- Why Central Banks Taper?
- How Tapering Works?
- Historical Case Studies & Lessons
- Market Impact
- Indicators to Watch
- Portfolio Strategies
- Common Misconceptions
- Practical Checklist
How Does it Differ from Related Moves?
- Tapering vs. rate hikes: Tapering reduces new liquidity injections, while rate hikes raise the policy interest rate. One can happen without the other.
- Tapering vs QT (Quantitative Tightening): Tapering stops net purchases; QT actively reduces the balance sheet (non-reinvestment or outright sales).
- Tapering vs. signaling: Tapering is both a flow change and a communication tool. Markets often react to the signal as strongly as to the actual flows.
Transmission Channels
1. Yield Channel
Reduced central bank bond purchases decrease demand, leading to higher bond yields. This translates into higher borrowing costs for corporations and households.
2. Portfolio Rebalancing Channel
With less demand from the central bank, private investors adjust their portfolios, shifting toward riskier assets. This reallocation affects relative asset prices across markets.
3. Expectations Channel
Tapering serves as a signal of future monetary policy normalization. Markets respond by re-pricing expectations of future short-term interest rates.
4. Currency Channel
Higher expected yields attract foreign capital inflows, strengthening the domestic currency. This appreciation influences both trade competitiveness and inflation dynamics.
Why Central Banks Taper?
Central banks generally initiate tapering when the emergency conditions that justified QE are easing. Specific triggers:
- Inflation approaching or exceeding the target: If inflation persists, central banks reduce stimulus to avoid overheating.
- Improved labor market: When unemployment falls and wage pressures rise, the argument for continued QE weakens.
- Financial stability concerns: Elevated asset-price bubbles or stretched credit conditions may prompt normalization.
- Policy normalization: After a crisis-era expansion, central banks aim to restore conventional policy space (i.e., lower balance sheet and room to cut rates in the future).
- Market functioning restored: If financial plumbing is healthy, the central bank needs to provide less backstop.
Decision calculus: Central banks consider real economy indicators (employment, capacity utilization), inflation trends (headline and core), and financial stability metrics (credit spreads, leverage, and margin behavior), often conditioning tapering on a mix of data rather than single data points.
How Tapering Works?
Step 1: Pre-announcement / Signaling
In the initial stage, central banks signal their intentions well in advance through speeches, meeting minutes, and staff projections. The purpose of this signaling is to mitigate market surprises, provide investors with time to adjust gradually, and prevent sudden or disorderly market movements.
Step 2: Announcement / Communications Package
The next step involves an official announcement, usually presented as a comprehensive communications package. This typically includes details such as the taper’s start date, the pace of reduction (for example, a fixed amount of asset purchases reduced each month), the conditionality based on economic data, and forward guidance that links the taper to the future interest rate path. Central banks may also provide a timetable or a range to retain flexibility.
Step 3: Implementation Mechanics
The central bank implements the taper in scheduled steps, systematically reducing its asset purchases in accordance with the plan. During this period, it typically continues to reinvest maturing holdings unless it decides to stop or shift toward quantitative tightening (QT). Flow dynamics are critical here because even small monthly reductions in purchases can have a significant impact over time, especially in thinly traded markets.
Step 4: Completion and Follow-Up
Tapering is complete when the central bank reduces net new asset purchases to zero. Afterward, the central bank’s focus shifts to interest rate policy and broader balance sheet management. At this stage, quantitative tightening may follow, often through the decision to stop reinvesting maturing securities or by setting explicit caps on runoff.
Step 5: Communication Best Practices
Throughout the entire process, effective communication remains essential. Central banks aim to be explicit about conditionality, clearly explaining which data points might pause or accelerate tapering. They often use concrete metrics, such as inflation thresholds or unemployment targets, rather than vague language. Additionally, coordinated messaging from multiple officials is essential to minimize mixed signals and maintain market stability.
Historical Case Studies & Lessons
The 2013 “Taper Tantrum”
What happened: markets reacted sharply when the possibility of reduced Fed purchases was signaled; long-term U.S. yields spiked, and global capital flows shifted.
Lessons:
- Communication matters: Ambiguous pauses triggered outsized moves.
- Emerging markets vulnerability: Countries with large external deficits and FX mismatches experienced outsized stress.
2014–2015 normalization episodes
As QE tapered and rate expectations shifted, yield curves repriced, and some long-duration assets underperformed. Central banks have learned to emphasize data dependency and staging.
2021–2022 (pandemic-era) example
Sequence: large pandemic-era QE → eventual tapering announcements → normalization, including rate hikes and QT.
Dynamics: High inflation prompted faster policy responses in many jurisdictions, compressing the transition between tapering and explicit tightening. Stock market rotations and bond yield volatility ensued.
Comparative examples: ECB, BoE, BoJ
Different central banks have different mandates and instruments. For example, a central bank with persistent low inflation might taper slowly and keep rates low longer; one facing sharp inflation will move faster. This heterogeneity affects cross-border capital flows and FX.
Market Impact
Government Bonds & Rates
- Primary impact: Upward pressure on long-term nominal yields; term premium often rises as central-bank demand diminishes.
- Curve dynamics: The yield curve initially steepens because the front end stays anchored while the long end rises, but it later flattens when markets price slower growth.
- Practical metric to watch: The 2s10s and 5s30s curve slopes and the change in the term premium component (if you use decomposition models).
Investment-Grade & High-Yield Credit
- IG credit: Tends to be resilient early if growth is solid; however, quality dispersion widens.
- HY credit: More sensitive to liquidity and risk premia; tightened liquidity can widen spreads and increase default risk in weaker issuers.
Equities
- Valuation channels: Higher discount rates reduce the present value of future cash flows, and long-duration tech names are most exposed.
- Sector rotation: Financials may benefit from steeper curves; defensives (utilities, staples) often underperform as yields rise.
FX & Capital Flows
- Rate differentials drive flows. Expected relative policy tightening typically supports a currency.
- Carry shifts: As DM yields rise, carry trades unwind in EM, pressuring local currencies and local-currency debt.
Commodities & Real Assets
- Gold & inflation hedges: Gold can underperform if real yields rise, but if taper coincides with higher inflation expectations, outcomes can differ.
- Real assets (such as real estate and infrastructure): Rate sensitivity matters high-quality leases and inflation-linked cash flows tend to perform better.
Volatility & Liquidity
- Tapering can compress or expand liquidity, depending on the market’s microstructure. Reduced central-bank backstops may increase realized volatility and widen bid-ask spreads on days of stress.
Indicators to Watch
Below are specific data points and market indicators that provide early signals of taper initiation, acceleration, or reversal.
Macro & Policy Data
- Headline inflation & core measures: CPI, Core CPI, PCE, Core PCE.
- Wage metrics: Average hourly earnings, unit labor costs.
- Labor market: Unemployment rate, payrolls (non-farm payrolls), participation rate.
- Activity indicators: ISM / PMIs, retail sales, industrial production.
Market-Implied Signals
- OIS & fed funds futures curve: Expected path of policy rates.
- Breakeven inflation rates (TIPS): Market-implied inflation expectations (5-year, 10-year).
- Real yields (nominal minus breakevens): Reflect real interest-rate expectations.
- Term premium estimates: Decomposed from the yield curve (if available).
- Credit spreads: The movements in high-yield and investment-grade spreads serve as a gauge of liquidity.
Financial Conditions & Flows
- Financial Conditions Index (FCI): A composite indicator that summarizes yields, credit spreads, and equity movements.
- FX flows & capital flight indicators: Cross-border equity/ bond flows into/out of EM.
- Market volatility: VIX (equity implied vol) and MOVE (bond vol) indices.
Central-Bank Specific
- Balance-sheet releases: Weekly/monthly central bank holdings.
- Minutes/transcripts: Language shifts in key phrases (e.g., “transitory” → “persistent”).
- Speeches by governors: Watch for “data-dependent” vs “now likely” wording.
Portfolio Strategies
Strategy design depends on time horizon, constraints, and risk tolerance. Below are tactical and strategic moves for various investor profiles, along with scripted triggers.
For Conservative Investors
Tactical moves:
- Shorten nominal duration (tactical underweight to long-duration government bonds).
- Increase cash & short-term bills ladder (flexibility to redeploy higher front-end yields).
- Add TIPS (Treasury Inflation-Protected Securities) to hedge against the risk of headline inflation.
Allocation example: Cash/Short-term (35%), TIPS/Inflation-Protected (20%), IG Credit (25%), Defensive Equities (15%), Alternatives/Liquidity (5%).
For Balanced Investors
Tactical moves:
- Barbell fixed-income approach: very short and selected mid-duration credits.
- Increase exposure to companies with strong free cash flow and pricing power.
- Consider floating-rate debt or bank-loan exposure for rising-rate buffers.
Allocation example: Equities (50%), Fixed Income (35 — mix of short duration, IG), Alternatives/Cash (15).
For Growth/Opportunistic Investors
Tactical moves:
- Rotate from long-duration growth into value, cyclical names, industrials, and financials.
- Use options (protective collars, put spreads) on concentrated growth positions.
- Selectively buy into dislocated EM assets if local fundamentals are solid and currency hedges are available.
Allocation example: Equities (70%), Credit/Alternative (20%), Cash/Hedges (10%).
Trade Ideas & Instruments
- Fixed-income ETFs / mutual funds: Prefer short-duration funds; avoid extended duration exposure.
- Inflation-linked bonds: Add for real-yield risk and persistent inflation scenarios.
- Floating-rate notes/ bank loan funds: Low duration in rising-rate regimes.
- Put spreads/collar structures: Efficient downside protection versus outright puts.
Risk Management & Triggers
Predefined trigger examples:
- If 10-year yield rises >100 bps in 3 months → reduce long-duration exposure by X%.
- If breakevens rise >75 bps and real yields fall → add inflation-protected allocations.
- If FX moves >5% vs base currency in 30 days → re-evaluate EM exposure and hedging.
Liquidity & margins: maintain cash buffers to meet margin calls and capture tactical buys on dislocations.
Common Misconceptions
- “Tapering automatically causes a recession.” No, the outcome depends on whether higher yields significantly slow demand. Tapering can be benign if growth and inflation evolve as expected.
- “Tapering instantly tightens credit.” Not always. The effect on credit depends on the investor’s positioning, funding conditions, and the strength of the underlying fundamentals.
- “Only rates move.” Tapering affects volatility, spreads, FX, and cross-asset correlations. It is a broad-market event.
Practical Checklist
- Map the rate and duration sensitivity of all portfolios, and identify the top ten holdings with the highest interest-rate exposure.
- Update stress tests to include scenarios of +50 bps, +100 bps, and +200 bps shocks to real yields, along with the corresponding equity revaluations.
- Set hedging thresholds and automate execution rules by executing a defined percentage of hedges once a trigger occurs.
- Reassess credit concentrations and monitor covenant risks within credit sleeves to manage potential vulnerabilities.
- Review liquidity positions and margin capacity every quarter to ensure resilience under stress conditions.
- Develop a clear, one-page communication plan for client-facing teams that explains the effects of tapering and outlines the recommended actions.
- Maintain a daily data-monitoring dashboard that tracks key market indicators, including yields, breakevens, credit spreads, the VIX, and major FX moves.
Frequently Asked Questions (FAQs)
Q1. How quickly do markets usually react to taper announcements?
Answer: Often, markets price in both the explicit flow change and the updated expectations for future rates immediately. Volatility typically spikes around announcements and follow-up speeches.
Q2. Can tapering be reversed?
Answer: Yes. Central banks can pause or reverse a taper if data deteriorates materially (growth shock, disinflation, large market stress).
Q3. Should retail investors sell all bonds when tapering starts?
Answer: No. Selling indiscriminately can lock in losses. A tactical shortening of duration and rebalancing to resilient credit and inflation protection is a more measured approach.
Q4. Do all countries respond the same?
Answer: No. Monetary policy, fiscal settings, and structural differences (such as currency regimes and external debt) create heterogeneous effects across countries.
Q5. How should an investor communicate the risk of tapering to clients?
Answer: Use simple analogies (e.g., tapering = gradually removing training wheels), provide scenario-based outcomes, and present an action checklist with clear triggers and timelines.
Recommended Articles
Explore related articles on quantitative easing, interest rate policy, and monetary tightening to understand how central banks shape markets. Delve into case studies on bond markets, inflation dynamics, and global capital flows for deeper context.

