Updated April 20, 2023
Overview of TensorBoard
TensorBoard is a visualization framework of TensorFlow for understanding and inspecting machine learning algorithm flow. The machine learning model’s evaluation can be done by many metrics such as loss, accuracy, model graph, and many more. The performance of the machine learning algorithm depends on model selection and hyperparameters fed in the algorithm. Experiments are performed by changing the values of those parameters.
The Deep learning models are just like a black box; it’s difficult to find the processing taking place inside it. It is important to get insight to build the model. With the help of visualization, you can know which parameters to modify by enhancing the model performance. So TensorBoard is an important tool to visualize each epoch during the model training phase.
Installation
To install the tensorboard using pip, run the following command:
pip install tensorboardAlternatively, it can be installed using the conda command:
Conda install tensorboardUsage
Using tensorboard with Keras model:
Keras is an open-source library for deep learning models. It is a high-level library that can be run on top of TensorFlow, theano, etc.
To install the TensorFlow and Keras library using pip:
Code:
pip install tensorflow pip install KerasLet’s take a simple example of classification using the MNIST dataset. MNIST is an English numeric dataset that contains images of numbers from 0-9. It is available with Keras library.
- Import the library TensorFlow as we will be using Keras with the TensorFlow backend.
Code:
import tensorflow as tf- First load the MNIST dataset from Keras into the training and test dataset.
Code:
mnist = tf.keras.datasets.mnist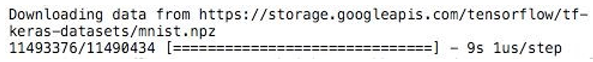
- The sequential model is created using:
Code:
tf.keras.models.Sequential- To train the model, Model.fit() is used. Logs can be created and stored using:
Code:
tf.keras.callback.TensorBoard- To enable histogram computing:
Code:
histogram_freq=1.It is off by default.
The code for the above-discussed classification of the MNIST dataset is as follows:
Code:
#   Simple NN to classify handwritten digits from MNIST dataset
import tensorflow as tf
import datetime
mnist = tf.keras.datasets.mnist
(x_train, y_train),(x_test, y_test) = mnist.load_data() x_train, x_test = x_train / 255.0, x_test / 255.0
def create_model():   return tf.keras.models.Sequential([     tf.keras.layers.Flatten(input_shape=(28, 28)),     tf.keras.layers.Dense(512, activation='relu'),     tf.keras.layers.Dropout(0.2),
tf.keras.layers.Dense(10, activation='softmax')
])
model = create_model() model.compile(optimizer='adam',
loss='sparse_categorical_crossentropy',
metrics=['accuracy'])
log_dir="logs/fit/" + datetime.datetime.now().strftime("%Y%m%d-%H%M%S")
tensorboard_callback = tf.keras.callbacks.TensorBoard(log_dir=log_dir, histogram_freq=1)
model.fit(x=x_train,            y=y_train,            epochs=5,            validation_data=(x_test, y_test),
callbacks=[tensorboard_callback])
To start the tensorboard on the local server, go to the directory location where TensorFlow is installed, and then run the following command:
Code:
tensorboard --logdir=/path/to/logs/files
Scalars

Scalars show change with every epoch. The above figure shows the graph of accuracy and loss after every epoch. epoch_acc and epoch_loss are training accuracy and training loss. At the same time, epoch_val_acc and epoch_val_lossare the accuracy and loss of validation data.
The lighter orange lines show exact accuracy or loss, and the darker one represents smoothed values. Smoothing helps in visualizing the overall trend in the data.
Graphs
The Graph page helps you to visualize the graph of your model. This helps you to check if the model is built correctly or not.
To visualize the graph, we need to create a session and then a TensorFlow FileWriter object. To create the writer object, we need to pass the path where the summary is stored and sess.graph as the argument.
Code:
writer = tf.summary.FileWriter(STORE_PATH, sess.graph)tf.placeholder() and tf.Variable() is used for placeholders and variables in the tensorflow code.
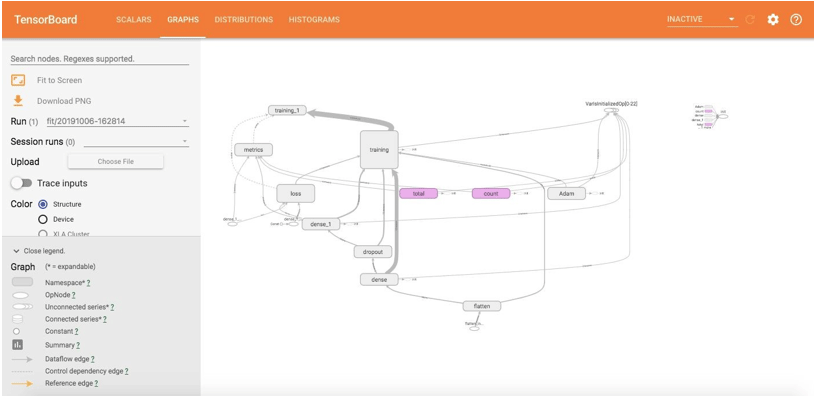
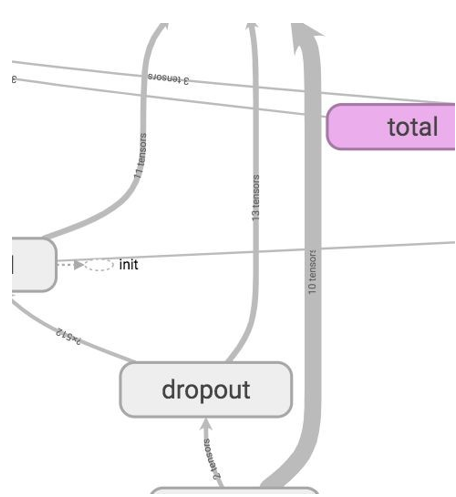
This shows the graphical visualization of the model that we have built. All rounded rectangles are namespaces. And ovals show the mathematical operations.
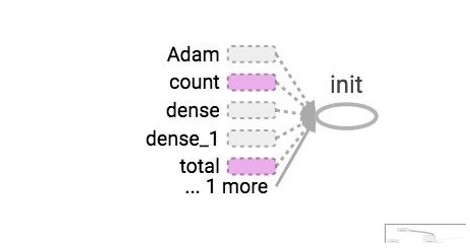
Constants are shown as small circles. The tensorboard simplifies using dotted ovals or rounded rectangles with dotted lines to reduce clutter in the graph. These are the nodes that are linked to many other nodes or all of the nodes. So they are kept as dotted in the graph, and their details can be seen in the upper right corner. In the upper right corner, linkage to gradients, Gradient Descents, or init nodes is provided.
To know the number of tensors going inside and coming out of each node, you can see the graph’s edges. The graph edges describe the number of tensors flowing in the graph. This helps in identifying the input and output dimensions from each node. This helps in debugging any problem.
Distributions and Histograms
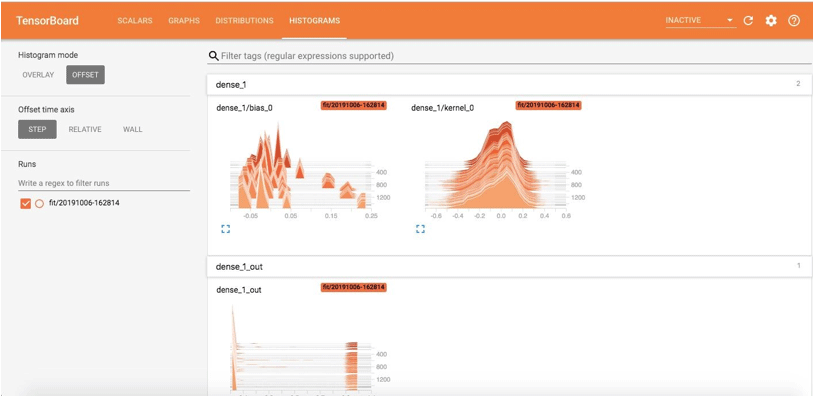
This shows the tensor distributions with time as well; we can see weights and biases. This shows the progress of inputs and outputs over time for every epoch. There are two viewing options:
Offset and Overlay
The Offset view of histograms will be as follows:
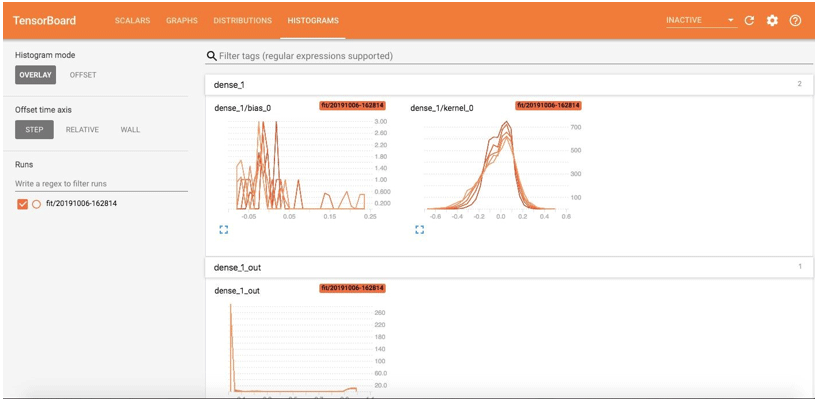
The Overlay view of the histogram is:
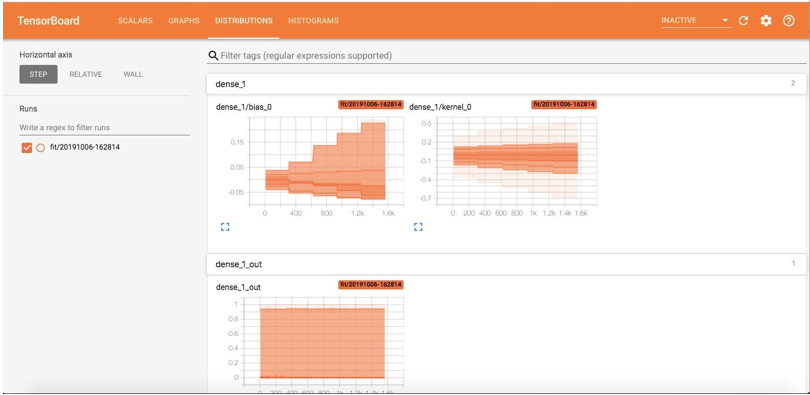
The Distribution page shows the statistical distributions. The graph shows the mean and standard deviations.
Benefits of TensorBoard
- The TensorBoard helps visualise the learning by writing summaries of the model like scalars, histograms or images. This, in turn, helps to improve the model accuracy and debug easily.
- Deep learning processing is a black box thing, and tensorboard helps understand the processing taking place in the black box with graphs and histograms.
Conclusion – TensorBoard
TensorBoards provides visualization for the deep earning model that is trained and helps in understanding them. It can be used with TensorFlow and Keras. It mainly provides visualizing the behaviour of scalars and metrics with the help of histograms and model graphs.
Recommended Articles
We hope that this EDUCBA information on “TensorBoard” was beneficial to you. You can view EDUCBA’s recommended articles for more information.
