Updated June 6, 2023

Introduction to Kibana
Kibana is used for the visualization of large datasets properly to understand deeper. We can use different methods to display results in Kibana, like line graphs, bar graphs, pie charts, heat maps, region maps, coordinate maps, gauges, goals, timelines, etc.
Kibana is coming along with ELK stack, which we called Elasticsearch, Logstash, and Kibana.
How to Install Kibana?
To install the kibana, go to the kibana main website and choose according to your system.
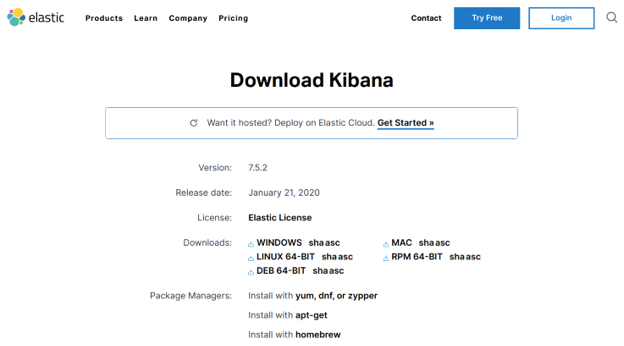
To install kibana in Ubuntu/Linux, use the following steps:
The first step is installing kibana; we must download a tar or deb file.
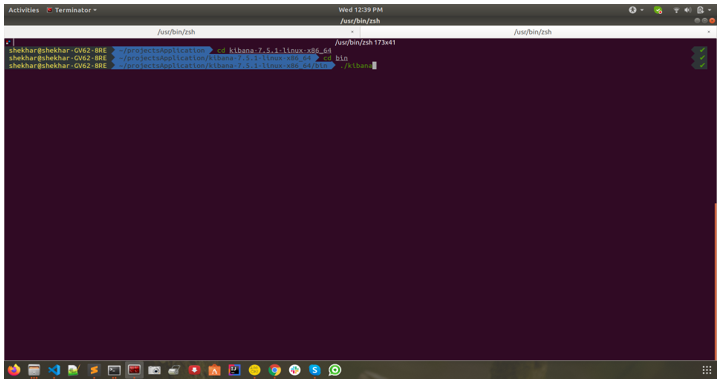
After downloading the tar file, keep it in a particular location and unzip it. After unzipping it, go to that folder and run the commands below:
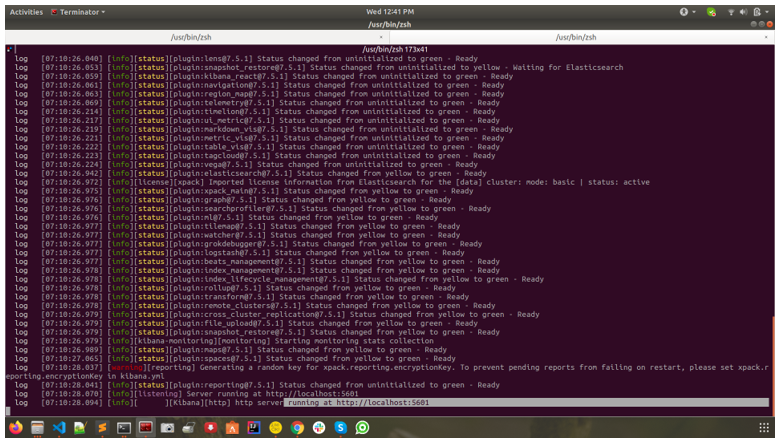
After that, kibana will start, and you can check it in localhost as shown in the image below:
Features of Kibana
Here are the features of Kibana mentioned below
1. Visualization
Kibana uses the data visualized in different ways. Most of the methods which are easy to visualize data are vertical bar charts, horizontal bar charts, pie charts, line graphs, heat maps, etc.
2. Dashboard
We can keep it on board when we visualize logs data or datasets. Seeing different kinds of options in one place will give more power to use data.
3. Dev Tools
Dev tools are the best way to learn for a beginner’s elastic search. We can copy and paste examples from the “elasticsearch documents example” to “kibana” and see what’s happening in real-time. It is also very simple and quick to add, update, and delete the indexes from it.
4. Reports
The visual data and dashboards can be converted to useful information reports in CSV format and as a URL to share code.
5. Filters and Search query
Writing the query in elastic search is a bit complex, but with the help of filters and search queries, we can get the desired information from the huge dataset.
6. Plugins
Kibana has very good in-built plugin features, but there is also an option to add a plugin of a third party so that we can get more power to explore data.
7. Coordinate and Region Maps
This feature map in Kibana helps visualize the geographical map, where they give a realistic view of the data.
8. Timeline
Timeline is another visualization feature of kibana which used for time data analysis. Sometimes we want to visualize how much data transfer speed during indexing in Elasticsearch, so we can get all those details from this feature. It also helps to compare data with the previous cycle day, week, month, etc.
9. Canvas
This is another kibana feature that helps represent the data in different color combinations in different shapes and texts.
Advantages of Kibana
- Kibana has the most impressive open-source feature, which helps us visualize a large volume of logs and displays inline graphs, bar graphs, pie charts, heat maps, etc.
- Kibana is very easy to understand for beginners.
- We can easily convert our visualization to reports for dashboards.
- We can easily use different colors to display complex data using Canvas.
- Kibana also has the facility of the timeline to visualize and compare data from previous records.
Disadvantages of Kibana
- Sometimes adding third-party plugins to Kibana will be tedious because of version mismatches.
- Sometimes not only plugin version issues occur because sometimes, when we upgrade them, the elasticsearch version also mismatch error occurs.
Machine Learning with Kibana
It is tough to recognize any cyberattack or sudden high peak in data graphs because, while monitoring, we used to depend on our eyes to search and trace the root cause of any problem, and to get an idea of such issues, we have to play with time pickers for setting different time ranges. We can do that by searching and discovering the trends and peaks in the graphs, but a tool can help us pinpoint these issues and let us know about any such incidents easily.
Using the X-Pack machine learning feature, we can create the jobs for any such requirements and obtain complete insight by identifying the outliers. It can also help us to perform a predictive analysis by reading the data available in Elasticsearch, applying algorithms, and then displaying it in Kibana.
Using Elastic Stack, we can get an insight into our data, such as the amount of traffic on a website, by seeing the requests per second. This information can show us the trends, such as the peak time, but if we want to get details, such as what is causing this, or the reason behind this trend, we can use X-Pack machine learning. It can provide us with these details (that are hidden behind the data) and can be explored using unsupervised machine learning for Elasticsearch.
X-Pack machine learning works on time series-based data and automates the analysis process by identifying the anomaly in data. We can apply it in real-time or set it for batch processing. It uses proprietary machine learning algorithms for running the machine learning job.
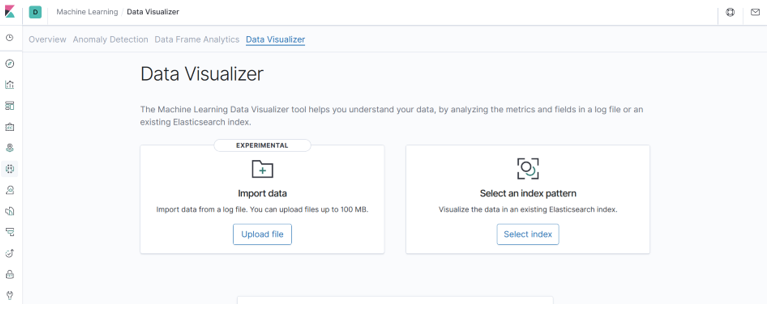
This blog will describe machine learning jobs involving single metrics, multi-metric, population, and advanced jobs. We will also discover the data visualizer option to get further insights into the data. Based on that understanding, we can decide on the field for machine learning analysis.
We will explore the anomaly explorer option to see the maximum anomaly score over time. It shows the anomaly as a block displayed in a different color.
Machine Learning Jobs
In Kibana, if we want to run any machine learning analysis, first, we have to create a machine learning job and execute that in the same order to get the result. A job holds all the details with configuration and metadata information used to perform the machine learning task.
One or more detectors for each job apply the analytical function to specific fields of our data. The job also has different features that affect anomaly consideration through types of events or entities. For example, entities are analyzed based on other entities in data or relative to their previous behavior.
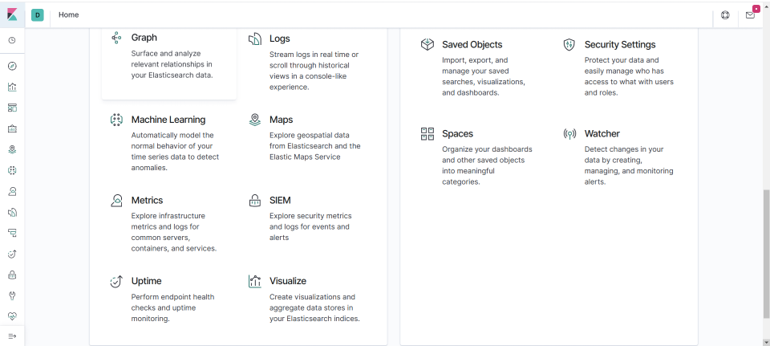
To run machine learning jobs, we need to go to the UI section of the kibana and run different kinds of machine learning jobs. We can use these features when we click on the left side option machine learning, which will open another window as given below:
Create a Super Cool Dashboard from a Web Application
Here, we will discuss how to pull the data from RDBMS using Logstash, push it to Elasticsearch, and then use the data in Kibana to create the dashboard.
I will explain how we can use Logstash to pull the data from the RDBMS and then send it to Elasticsearch, where we can read it in Kibana to create the dashboard. This approach is quite interesting as we are not changing the application to get the data but simply using the JDBC connector of Logstash that provides us the facility to pull the data directly from any RDBMS just by writing the queries after connecting to the database server.
For this type of dashboard creation, we need to create a star schema table and pull the data into it from other tables, the same approach we use to apply for reporting. Once that is done, we can use the JDBC connector to pull the data using queries in Logstash. Logstash pulls the data from RDBMS, and we can configure it to send it directly to Elasticsearch. Then, we can create the index pattern in Kibana to use that index to create the dashboards.
The following diagram depicts the architecture of kibana:
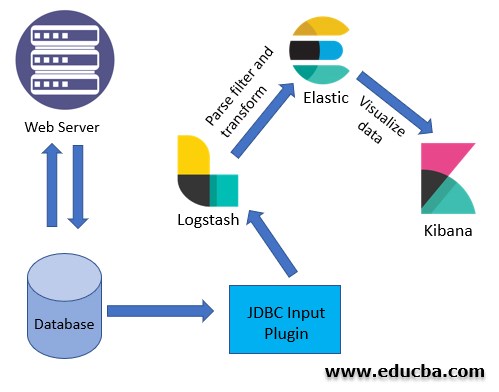
The preceding diagram shows a web server connected to a database for reading and writing operations. We are using the JDBC input plugin of Logstash to fetch the data from the database by writing queries. This data is then sent to Elastic, and Kibana uses that data to create the dashboards. So, first of all, we need to understand how the JDBC input plugin works.
Conclusion
Kibana is an open source for the visualization of large volumes of data. Also, a third-party plugin makes it more powerful to control the data to get more information from the logs or datasets. Like kibana, some other tools are also available, but the best thing about kibana is that it is a part of the ELK stack.
Recommended Articles
This is a guide to What is Kibana? Here we discuss the installation process of Kibana and its features along with the advantages and disadvantages. You may also have a look at the following articles to learn more –

