Updated July 31, 2023
Difference Between Variance vs Covariance
Variance is nothing but a statistical measure of how much a set of observations differs from each other. Variance is often used as a measure of risk in finance. In the financial and accounting world variance means how much actual expenses deviate from the forecast or budget amount. Variance is nothing but the measure of volatility it measures how much stock differs from its average or mean value. Covariance is a mathematical term that measures how much two random variables will vary together. It evaluates how much the variables change together. In the financial world, the concept of covariance is used in portfolio theory. Covariance is a systematic relationship between a pair of random variables.
Changes in one variable will result in the equivalent change in another variable. It measures the direct relationship between two risky assets but it does not show the strength of the relationship between the two assets. In the financial world covariance is calculated to help diversify security holdings.
Variance
Variance is a useful indicator of how much risk an individual stock comes with, and because of this, it is easy for the investor to make an investment decision. If the variance of the stock is higher, it means that the stock will fluctuate more widely, so it means that the higher the variance, the riskier the stock.
A variance is just an act of comparing the standard with the actual. Companies set a standard and compare actual performance with that standard. The variance analysis sheet is usually prepared by an accountant in business, which is the importance of accounting in decision-making. The main objective of variance analysis is to review cost control and cost reduction.
Variances are classified under 4 main heads.
1. Element cost
- Material Cost Variance.
- Labour Cost Variance.
- Overhead Variance.
2. Controllability
- Controllable Variance.
- Uncontrollable Variance.
3. Impact
- Favorable Variance.
- Unfavorable Variance.
4. Nature
- Basic Variance.
- Sub-Variance.
The Benefit of Variance
- Variance helps in finding out all inefficient performances and the extent of inefficiency.
- Variance method used for cost controls.
- With the help of variance method results, a manager can decide on cost reduction.
- With the help of the variance method, the top management properly carries out profit planning.
Covariance
Covariance gives positive or negative values. Positives value indicate that two variables move in the same direction, whereas negative values show that two variables move in the inverse direction. Positive Covariance shows that asset returns have moved in the same direction, and both assets are likely to have the same return. Negative covariance shows that the return moved in opposite directions, one asset has a positive return, and others are likely to have a negative return. A high Covariance result indicates a strong relationship between two variables, and a low value indicates a weak relationship between two variables. The covariance has a drawback. It only measures the direct relationship between two assets and cannot show the strength of a relationship between two assets.
The Benefit of Covariance
- If a portfolio is highly volatile and there is a need to reduce that volatility, the covariance method is used to compare the combined portfolio.
- Covariance is an important tool for an investor as it gives them how the stock moves in the future by analyzing the historical price data of two stock portfolios.
- It uses in the diversification of the portfolio.
It uses in the Stock market and stock trading to construct portfolios to identify stocks that are a good place to work together.
Head To Head Comparison Between Variance vs Covariance (Infographics)
Below is the top 6 difference between Variance vs Covariance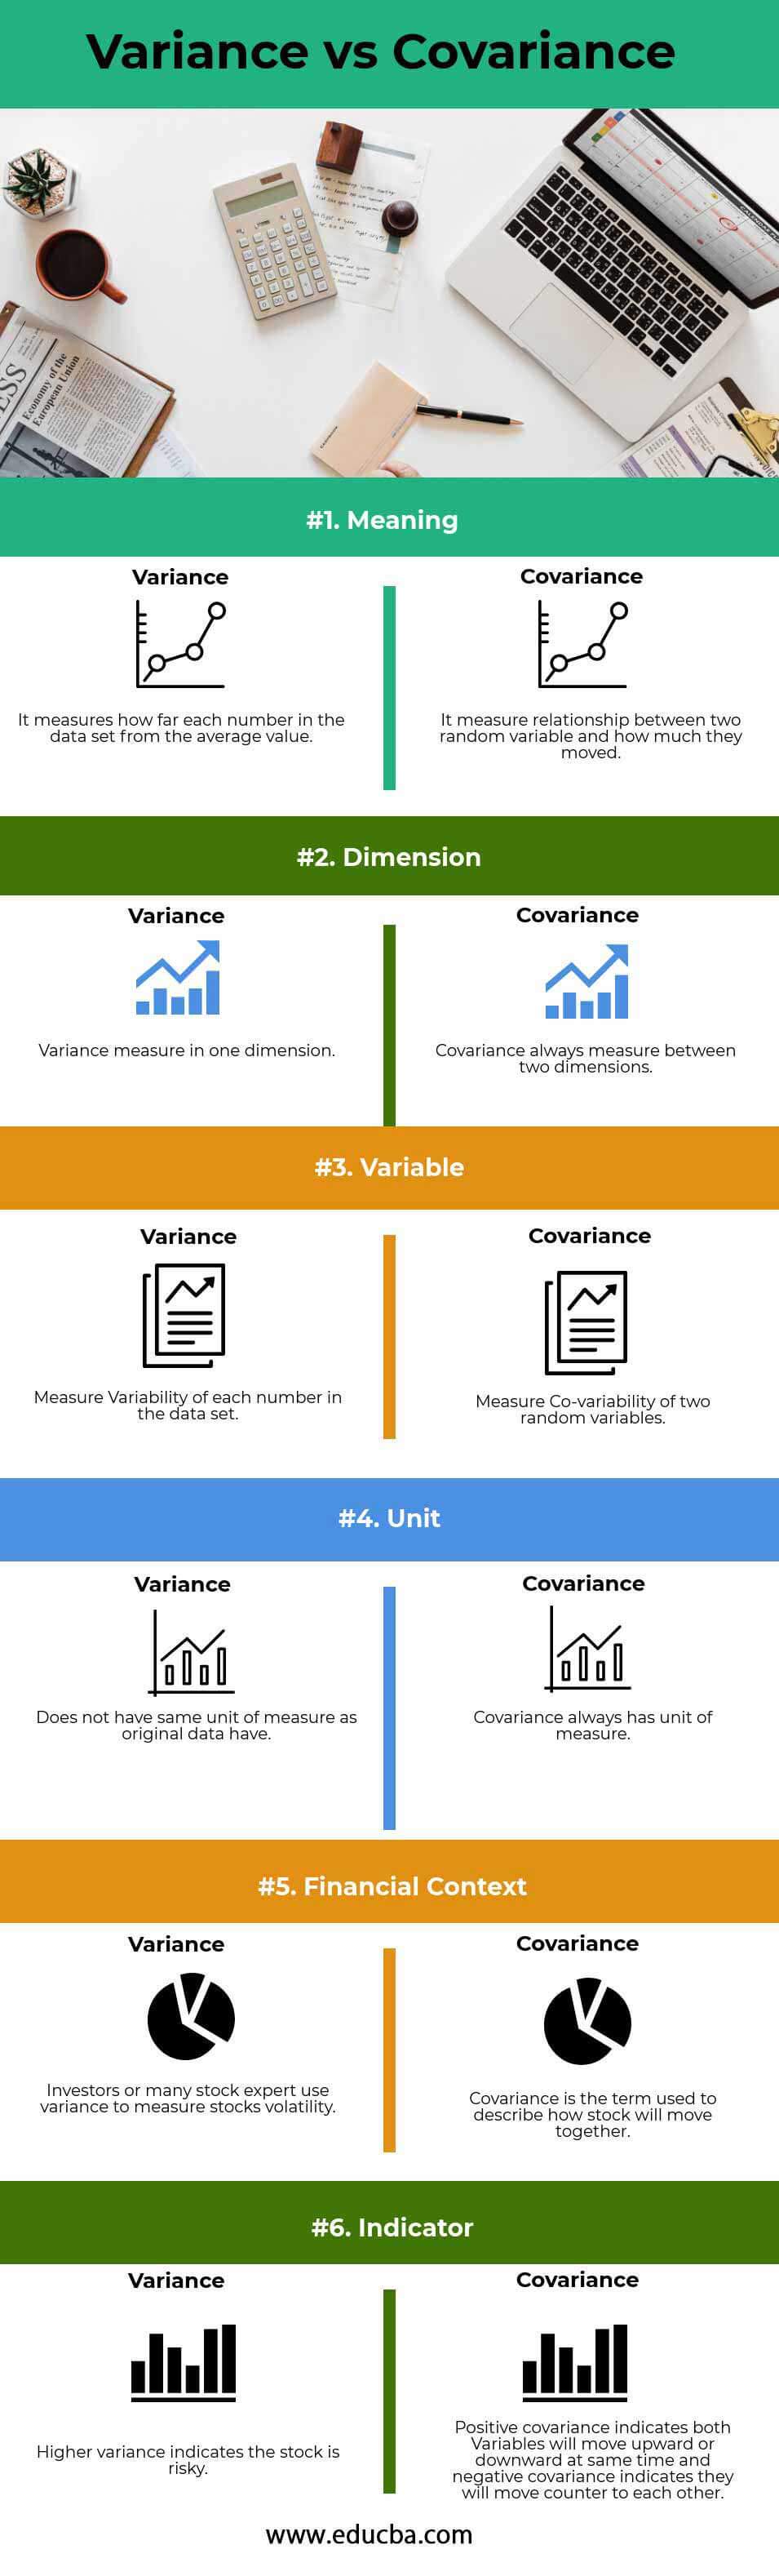
Key Differences Between Variance vs Covariance
Let us discuss some of the major differences between Variance vs Covariance:
- Variance is the average of the residuals of the same variable, but the covariance is the degree of variation between two variables.
- Variance tells us how single variables vary, whereas Covariance tells us how two variables vary.
- Covariance is in two dimensions because of two variables, whereas variance is in one dimension.
- Variance measures the volatility of variables, whereas Covariance measure indicates the extent to which two random variables change.
- Covariance can be negative or positive, whereas variance is non-negative.
Variance vs Covariance Comparison Table
Let’s look at the top 6 Comparison between Variance vs Covariance
|
Basis Of Comparison |
Variance |
Covariance |
| Meaning | It measures how far each number in the data set is from the average value. | It measures the relationship between two random variables and how much they moved. |
| Dimension | Variance measures in one dimension. | Covariance always measures between two dimensions. |
| Variable | Measure the Variability of each number in the data set. | Measure the Co-variability of two random variables. |
| Unit | It does not have the same unit of measure as the original data. | Covariance always has a unit of measure. |
| Financial Context | Investors or many stock experts use variance to measure stock volatility. | Covariance is the term used to describe how a stock will move together. |
| Indicator | Higher variance indicates the stock is risky. | Positive covariance indicates both Variables will move upward or downward simultaneously, and negative covariance indicates they will move counter to each other. |
Conclusion – Variance vs Covariance
So from the above description, it is clear that variances and covariance are mathematical statistics terms used in the financial world or by an organization to make the decision. Even though both variances vs covariance terms sound the same, they have different meanings. Variance is one dimension, and covariance is a two dimensions measurable technique that measures the volatility and relationship between the random variables. The higher the Volatility in stock, the more risky the stock, and buying stock with negative covariance is a great way to minimize the risk. A positive covariance means assets move in the same direction, whereas negative covariance means assets generally move in the opposite direction.
Recommended Articles
This has been a guide to the top difference between Variance vs Covariance. Here, we discuss the Variance vs Covariance key differences with infographics and a comparison table. You may also have a look at the following articles to learn more.
