Updated May 29, 2023
Introduction to Data Analysis
Data analysis is the process of capturing useful information by inspecting, cleansing, transforming, and modeling the dataset; methodologies involved in doing so can be categorized as Descriptive Analysis(it gets the insight of the data numerically), Exploratory Analysis( it receives the wisdom of the information visually), Predictive Analysis( it conveys the sense of the data using historical events) and Inferential Analysis(this involves getting the understanding of the population by obtaining the information from the sample).
Types of Data Analysis
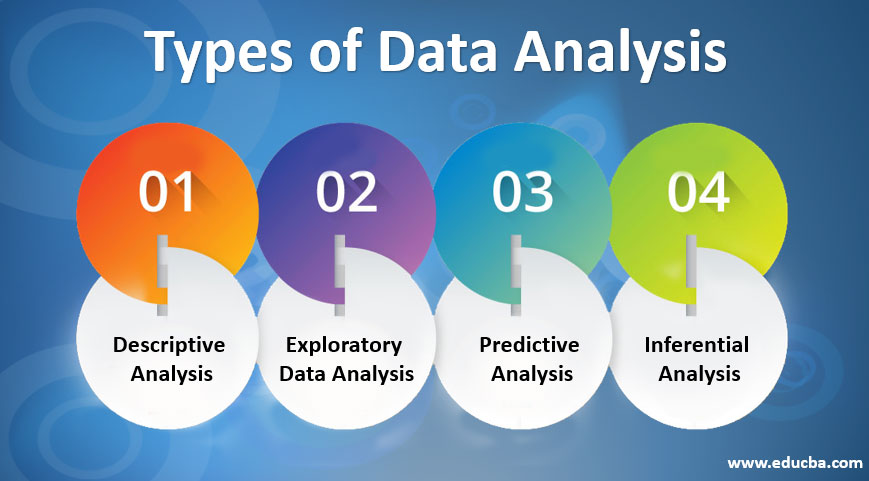
Based on the methodologies used, data analysis can be divided into the following four parts:
- Descriptive Analysis
- Exploratory Data Analysis
- Predictive Analysis
- Inferential Analysis
1. Descriptive Analysis
Descriptive analysis is the numerical way to get insights into the data. In the descriptive analysis, we get a summarized value of the numerical variables. Suppose you are analyzing the sales data of a car manufacturer. In the literature of descriptive analysis, you will seek questions like what is the mean, mode of the selling price of a car type, what was the revenue incurred by selling a particular type of car, etc. We can get the central tendency and the dispersion of the numerical variables of the data using this type of analysis. In most practical data science use cases, a descriptive analysis will help you to get high-level information on the data and get used to the data set. Important terminologies of the descriptive analysis are:
- Mean (average of all numbers in a list of numbers)
- Mode (most frequent number in a list of numbers)
- Median (middle value of a list of numbers)
- Standard deviation (amount of variation of a set of values from the mean value)
- Variance (square of standard deviation)
- Inter Quartile Range (values between 25 and 75 percentile of a list of numbers)
In Python, the panda’s library provides a method called ‘describe,’ which includes descriptive information about the data frame. We can also use other libraries like the stats model or develop our code per the use case.
2. Exploratory Data Analysis
In contrast to descriptive data analysis, where we analyze the data numerically, exploratory data analysis is the visual way to analyze the data. Once we have a basic understanding of the data through descriptive analysis, we will move to exploratory data analysis. We can also divide the exploratory data analysis into two parts:
- Uni variate analysis (exploring characteristics of a single variable)
- Multivariate analysis (comparative analysis of multiple variables, if we compare the correlation of two variables, it is called bivariate analysis)
In the visual way of data analysis, we use various plots and graphs to analyze data. To explore a single variable (univariate analysis), we can use a bar plot, histograms, box plot with whisker, violin plot, etc. For multivariate analysis, we use scatter plots, contour plots, multi-dimensional plots, etc.
But why do we need Exploratory Data Analysis?
- Exploratory data analysis gives a visual way to describe the data, which helps to identify the characteristics of the data more clearly.
- It helps us to identify which features are more important. This is particularly useful when we deal with high-dimensional data. (i.e., methods like PCA and t-SNE help in dimensionality reduction).
- It is an effective way to explain the incurred result to executives and non-technical stack holders.
In Python, there are many libraries to perform exploratory data analysis. Matplotlib, Seaborn, Plotly, Bokeh, etc., are the most popular.
3. Predictive Analysis
What happens if we know the mistakes we will make in the future in advance? Will we try to avoid those? Predictive analysis is the most scientific way to predict future outcomes by analyzing historical events. The heart of data science is based on predictive analysis. Predictive analysis helps us answer the following questions: ‘Can we predict if a buyer will purchase a specific product?’ Or ‘Can we estimate the total cost an Insurer has to pay for the claims? ‘Or ‘Can we estimate the amount of rainfall in the upcoming monsoon?’
Predictive analysis helps us give the approximated or most likely outcome of the critical questions that result in massive scaled business and socio-economical changes. Machine learning models are developed based on historical data to predict the outcome of similar unseen future events.
4. Inferential Analysis
The inferential analysis is the data science literature, while we predict the referential outcome for multiple sectors. For example, we derive the consumer price index or per capita income. It is not feasible to reach each consumer one by one and calculate. Instead, we scientifically take samples from the population, and with the help of statistical analysis, we derive the index.
Conclusion
In this article, we have discussed the various methodologies of data analysis. Do we need to use all these methods, or can we use any of them? Well, now it is based on the use case and domain of the application. But in most cases, we will start with descriptive and exploratory data analysis and develop predictive models to predict future outcomes.
Recommended Articles
This is a guide to Types of Data Analysis. Here we discuss the introduction and different types of data analysis, respectively. You can also go through our suggested articles to learn more –

