EDUCBA

EDUCBA

MENUMENU
  • Free Tutorials
  • Certification Courses
  • 120+ Courses All in One Bundle
  • Login
Home Excel Excel Resources Statistical Functions in Excel Excel TREND Function
Secondary Sidebar
Excel Functions
  • Statistical Functions in Excel
    • COUNTIF Formula in Excel
    • COUNTIF Multiple Conditions
    • COUNTIFS with Multiple Criteria
    • Statistics in Excel
    • Confidence Interval in Excel
    • Interpolate in Excel
    • Linear Programming in Excel
    • COUNTIFS in Excel
    • Excel Variance
    • Normal Distribution Formula in Excel
    • Count Cells with Text in Excel
    • Excel Formula For Rank
    • Linear Regression in Excel
    • COUNTA Function in Excel
    • MAX Formula in Excel
    • Excel NORMSINV
    • Count Names in Excel
    • FORECAST Formula in Excel
    • NPER in Excel
    • Excel Median Formula
    • Lognormal Distribution in Excel
    • Excel Chi Square Test
    • Count Formula in Excel
    • COUNTIF Examples in Excel
    • Excel P-Value
    • COUNTIF Not Blank in Excel
    • Excel Standard Deviation Formula
    • Excel GROWTH Formula
    • Excel Percentile Formula
    • Excel Frequency Formula
    • Excel Average Formula
    • Excel Correlation Matrix
    • Excel Z Score
    • Excel MAX IF Function
    • Z TEST in Excel
    • Excel Trendline
    • Excel F-Test
    • Excel STDEV Function
    • Excel Frequency Distribution
    • DCOUNT Function in Excel
    • Excel MIN Function
    • Excel Forecast Function
    • FREQUENCY Excel Function
    • COUNTIF with Multiple Criteria
    • Standard Deviation in Excel
    • MAX Excel Function
    • Excel QUARTILE Function
    • Excel T.Test Function
    • Excel PERCENTILE Function
    • MODE Excel Function
    • SLOPE Excel Function
    • Excel Median Function
    • Excel TREND Function
    • Excel Count Function
    • Excel LARGE Function
    • SMALL Excel Function
    • COUNTIF Excel Function
    • Excel AVERAGE Function
    • Excel CORREL Function
  • Excel Functions (12+)
  • Excel Tools (114+)
  • Financial Functions in Excel (17+)
  • Logical Functions in Excel (14+)
  • Lookup and Reference Functions in Excel (35+)
  • Maths Function in Excel (47+)
  • TEXT and String Functions in Excel (26+)
  • Date and Time Function in Excel (24+)
  • Information Functions in Excel (4+)
  • Excel Charts (56+)
  • Excel Tips (222+)
  • Workplace Productivity (4+)
  • Microsoft Office Tools (15+)
  • Excel Formula and Functions (22+)
  • MS Excel Shortcuts (4+)
Excel Functions Courses
  • EXCEL ADVANCED Training Certification
  • Online Excel for Marketing Course

Excel TREND Function

By Madhuri ThakurMadhuri Thakur

TREND Function in Excel

TREND in Excel (Table of Contents)

  • TREND Function in Excel
  • TREND Formula in Excel
  • How to Use TREND Function in Excel?

TREND Function in Excel

TREND function is a built-in function in excel which comes under the category of Statistical function to calculate the linear trend line of known y’s and know x’s. TREND function uses the “Least square method to find the line of best fit and to find new y-value for the given x-values. This function is used to predict the future based date where it will be very useful in accounting and financial reporting.

TREND Formula in Excel

The Formula for the TREND Function in Excel is as follows:

TREND Formula in Excel

Start Your Free Excel Course

Excel functions, formula, charts, formatting creating excel dashboard & others

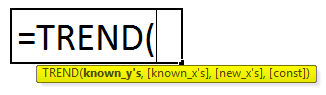
TREND Function uses the below arguments as follow:

Known_y’s: The known y’s is a range or array of y values from the line equation.

Known_x’s: The known x’s is a range or array of x values from the line equation. If this x value is null, excel will assume those x_values as 1,2,3..with the same number of values as y values.

New_x ’s: The new_x’s represent the new_x value for which we need to trend to return corresponding values; if the new x argument is null (omitted), it is considered known_x’s value.

Const: The const is a logical value that specifies either “TRUE” or “ FALSE”.

TREND Function:

TREND function is used for multiple values, which are capable of calculating multiple y values and multiple values.

Trend function has four arguments where the first argument is “known y value” and the second argument is “known x value” and the third argument is “ new x values”, and the fourth argument is a constant value which represents “ TRUE” or “FALSE”.

Trend function is an array function that is used to add a trend line to a given chart where we can calculate data and extend the forecast result.

Note: The existing data needs to be linear data; otherwise the output will be inaccurate.

Known_ Y-: This Known y_values is a dependent array or range of data.

All in One Excel VBA Bundle(120+ Courses, 30+ Projects)
Basic ExcelAdvanced ExcelVBA & MacrosExcel Dashboards
Pivot TablesStatistical FunctionsFinancial FunctionsCharts & Graphs
Price
View Courses
120+ Online Courses | 30+ Projects | 500+ Hours | Verifiable Certificates | Lifetime Access
4.9 (64,813 ratings)

Known_ X-: This Known x_values is an independent array or range of data.

New_X-: This new x value is used to return corresponding y values.

Const-: This const is a logical value, i.e. TRUE or FALSE.

Steps of TREND Function in Excel

We can find the TREND Function under Statistical function here; we are going to see step by step procedure on how to use it :

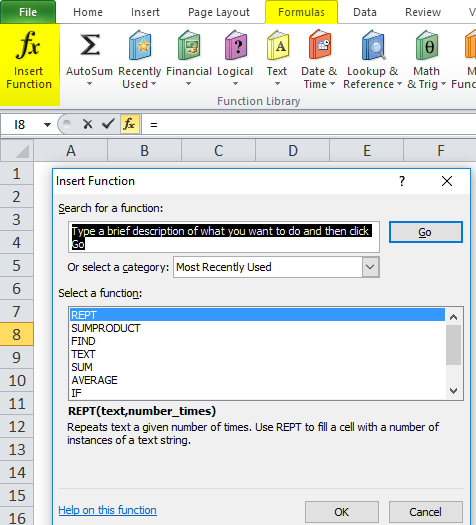
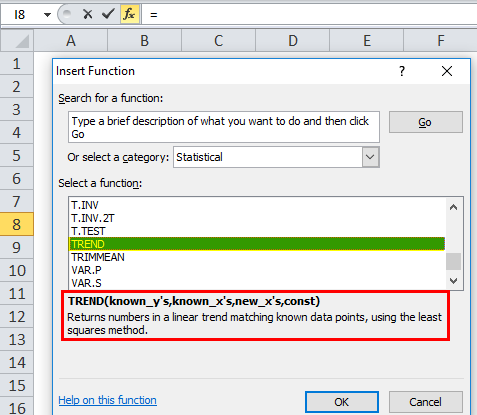
  • Choose the insert function, and you will get the below dialogue box, as shown below.

TREND Step 1

  • Select the category statistically; once you choose the category, you will get a list of the function displayed as shown in the below screenshot.

TREND Step 2

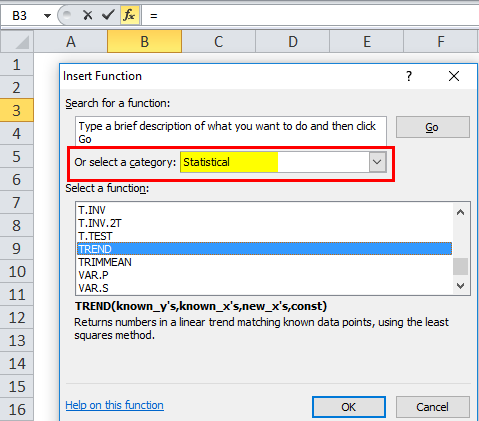
  • Select TREND function

TREND Step 3

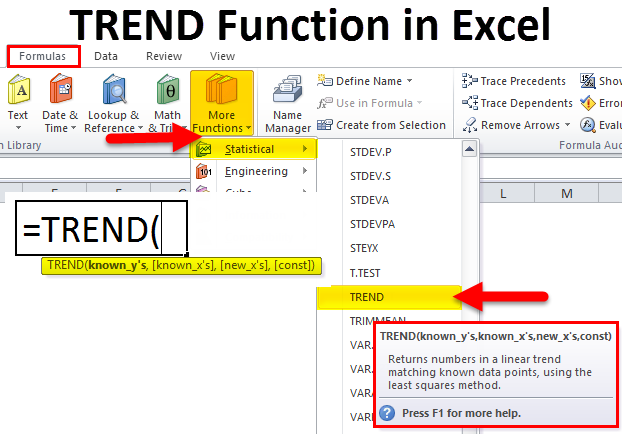
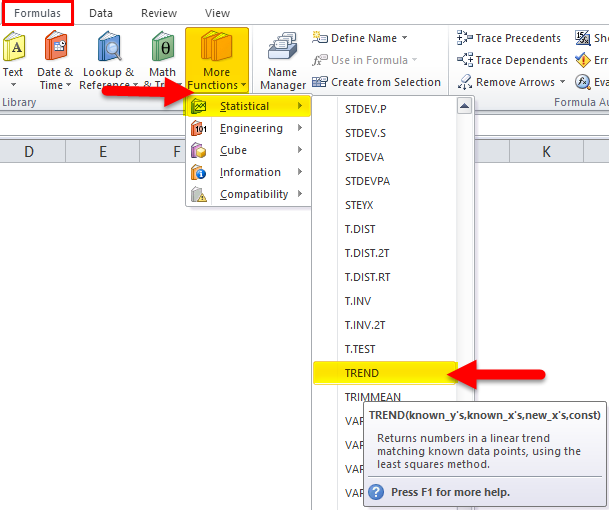
In the advanced version, we will have a shortcut in the formula bar called more function and follow the below procedure.

Go to formulas–>Choose More Function–>Statistical–>TREND

TREND another step

How to use the TREND function in excel?

TREND Function in Excel is very simple and easy to use. Let us understand the working of TREND in Excel by Some Examples.

You can download this TREND Function Excel Template here – TREND Function Excel Template

Example #1

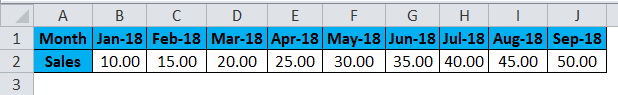
In this example, we have month wise sales data from Jan-18 to Sep-18 where we need to find the next month sales by using the TREND Function in Excel.

TREND Example 1

Using below TREND Formula.

TREND Example 1-1

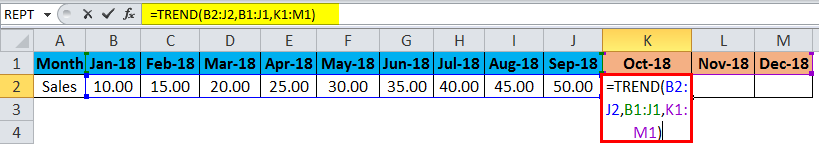
Here the Trend function with the next month sales has been shown below.

TREND Example 1-3

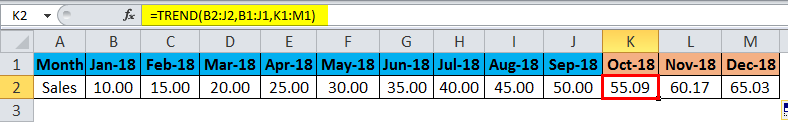
So we have predicted the upcoming sales value for the next three months.

Example #2

Let’s see another example with a graphical chart format using multiple values.

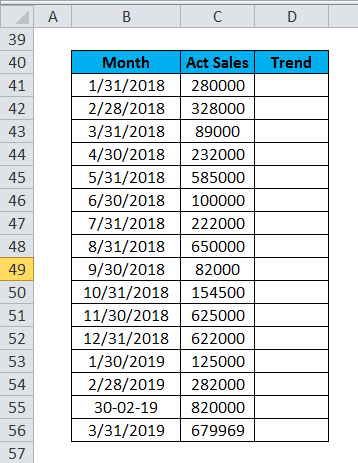
The below example shows months wise sales data where there are ups and downs in sales value; if we produce this format, we cannot view the sales data easily; hence we can show the sales data in using trend function in chart format so that I will be given the appropriate result.

B40 represents Month, C40 represents actual sales, and D40 represents Trend values in the sales data.

TREND Example 2

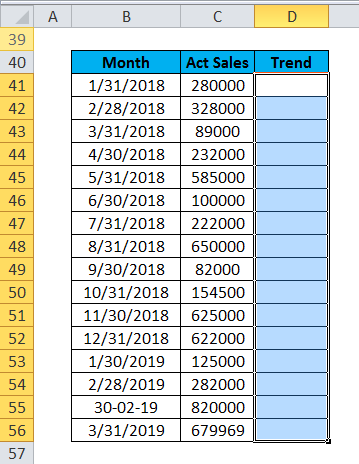
We are going to using the trend function here to get the result, select the column D41 to D56 and use the trend function as per below.

TREND Example 2-1

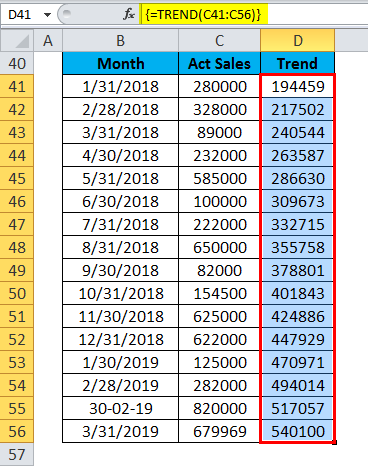
After selection, we use the Trend function by selecting C41: C56 and then we have to use CTRL+SHIFT ENTER to get the entire trend value shown below.

TREND Example 2-2

To view in graphical chart format, choose insert and select the line chart format.

TREND Example 2-3

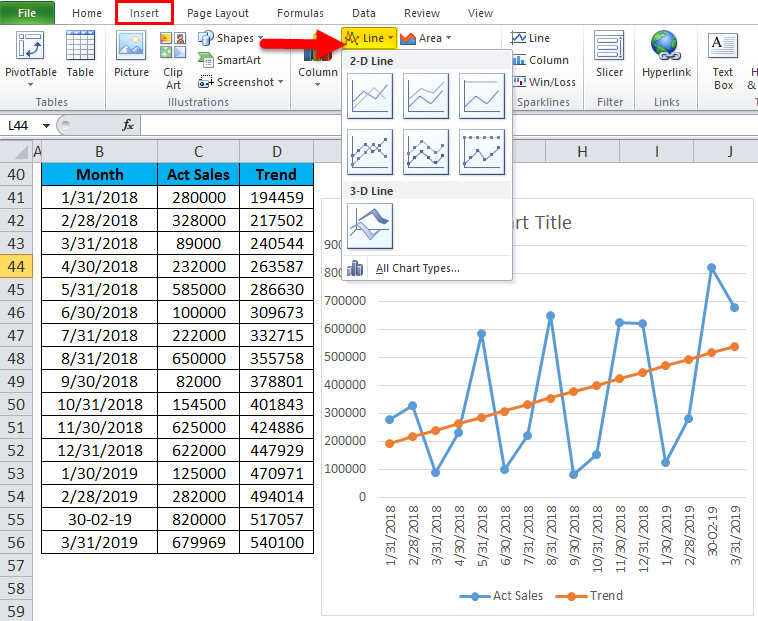
So we get the line chart graph as given below where it shows very clearly sales data month wise.

TREND Example 2-4

Now, this sales data shows only the trend figure with orange line show linear values, and the graph will be more dynamic if we put the month-wise growth value.

Use the growth function as explained above using CTRL+SHIFT+ENTER; we will get a growth value figure with another line chart which is shown below in grey color.

TREND Example 2-5

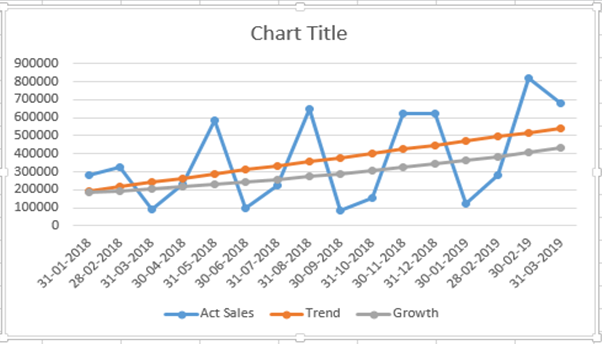
In sales and financial accounting scenario, these charts are helpful to predict the company production and growth.

Things to Remember About TREND Function in Excel

  • Trend Function in Excel helps in determining an array of multiple values.
  • In a Business analysis, trend function can be used to analyze revenue, cost, and investment
  • FMCG Company can create a trend line of historical sales, and this information can be used to predict the future changes that will be happening in the sales.
  • Trend analysis is mainly important in the business, financial, FMCG and other companies to predict future trending sales.
  • It is also used in Investment concern to predict the future shares
  • In project management, trend analysis is a mathematical technique that uses present data to predict future outcome.
  • Trend analysis helps determine that the company is achieving their planned goals, so that management can compare that margin wise sales have reached up or down by performing this trend analysis.
  • Used as a real-time and time-based data analysis.

Recommended Articles

This has been a guide to TREND in Excel. Here we discuss the TREND Formula in Excel and how to use TREND Function in Excel along with excel example and downloadable excel templates. You may also look at these useful functions in excel –

  1. VLOOKUP Function in Excel
  2. TANH Function in Excel
  3. NPV Function in Excel
  4. SUBTOTAL Function in Excel
Popular Course in this category
Excel Advanced Training (16 Courses, 23+ Projects)
  16 Online Courses |  23 Hands-on Projects |  140+ Hours |  Verifiable Certificate of Completion
4.8
Price

View Course

Related Courses

Excel for Marketing Training (8 Courses, 13+ Projects)4.9
0 Shares
Share
Tweet
Share
Primary Sidebar
Footer
About Us
  • Blog
  • Who is EDUCBA?
  • Sign Up
  • Live Classes
  • Corporate Training
  • Certificate from Top Institutions
  • Contact Us
  • Verifiable Certificate
  • Reviews
  • Terms and Conditions
  • Privacy Policy
  •  
Apps
  • iPhone & iPad
  • Android
Resources
  • Free Courses
  • Excel Charts
  • Excel Tips
  • All Tutorials
Certification Courses
  • All Courses
  • Excel VBA Course - All in One Bundle
  • VBA Course
  • Excel Data Analysis Course
  • Excel for Marketing Course
  • Excel for Finance Course
  • Excel for HR Training

ISO 10004:2018 & ISO 9001:2015 Certified

© 2022 - EDUCBA. ALL RIGHTS RESERVED. THE CERTIFICATION NAMES ARE THE TRADEMARKS OF THEIR RESPECTIVE OWNERS.

EDUCBA
Free Excel Course

Excel functions, formula, charts, formatting creating excel dashboard & others

*Please provide your correct email id. Login details for this Free course will be emailed to you

By signing up, you agree to our Terms of Use and Privacy Policy.

EDUCBA Login

Forgot Password?

By signing up, you agree to our Terms of Use and Privacy Policy.

EDUCBA
Free Excel Course

Excel functions, formula, charts, formatting creating excel dashboard & others

*Please provide your correct email id. Login details for this Free course will be emailed to you

By signing up, you agree to our Terms of Use and Privacy Policy.

EDUCBA

*Please provide your correct email id. Login details for this Free course will be emailed to you

By signing up, you agree to our Terms of Use and Privacy Policy.

Let’s Get Started

By signing up, you agree to our Terms of Use and Privacy Policy.

EDUCBA

Download TREND Function Excel Template

EDUCBA

Download TREND Function Excel Template

EDUCBA

डाउनलोड TREND Function Excel Template

This website or its third-party tools use cookies, which are necessary to its functioning and required to achieve the purposes illustrated in the cookie policy. By closing this banner, scrolling this page, clicking a link or continuing to browse otherwise, you agree to our Privacy Policy

Loading . . .
Quiz
Question:

Answer:

Quiz Result
Total QuestionsCorrect AnswersWrong AnswersPercentage

Explore 1000+ varieties of Mock tests View more