Updated February 27, 2023
Introduction to Time-series Analysis
The Series of data points recorded over a specified period of time is called Time-series data. Time-series analysis is a technique for analyzing time series data and extract meaningful statistical information and characteristics of the data. One of the major objectives of the analysis is to forecast future value. Extrapolation is involved when forecasting with the time series analysis which is extremely complex. But, the forecasted value along with the estimation of uncertainty associated with that can make the result extremely valuable.

Time series analysis can be useful in achieving the same.
What is Time Series Analysis?
Time series analysis is a statistical method to analyse the past data within a given duration of time to forecast the future. It comprises of ordered sequence of data at equally spaced interval.To understand the time series data & the analysis let us consider an example. Consider an example of Airline Passenger data. It has the count of passenger over a period of time.
Exploratory Analysis:
The first step is to perform the exploratory analysis which is carried out by plotting a line chart of the count of passengers against time. Figure 1 shows the count of passenger on y-axis and time on x-axis where each interval can be considered as a year.
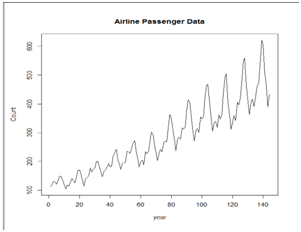
On careful observation of the below graph following observations can be derived.
1. TREND: Increasing or decreasing pattern has been observed over a period of time. In this case, the gradually increasing underlying trend is observed. i.e. the count of passengers has increased over a period of time.
2. SEASONALITY: Refers to cyclic pattern. A similar pattern that repeats after a certain interval of time. In the airline passenger example, we can observe a cyclic pattern that has a certain high & a low point which is visible in all the interval.
3. HETROSCEDASTICITY: Refers to Non-constant variance or varying deflection from the mean over a period of time. In the below plot the variance has increased continuously over a period of time.
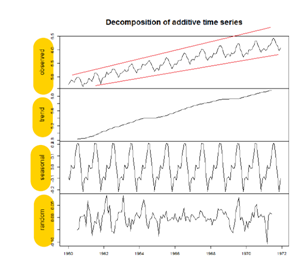
Figure 2 shows the graph of the Airline passenger data and the decomposed components (highlighted on the left) that we discussed above. Namely:
- Trend
- Seasonality
- Heteroscedasticity (Red lines show the heteroscedasticity)
Importance of Time Series Analysis
Ample of time series data is being generated from a variety of fields. And hence the study time series analysis holds a lot of applications. Let us try to understand the importance of time series analysis in different areas.
- Field of Economics: Budget studies, census Analysis, etc.
- Field of Finance: Widely used in the field of finance such as to understand the stock market fluctuations, yield management, understand the market volatility, etc.
- Social Scientistà: Birth rates or death rates over a period of time and can come with the schemes in their interest.
- Healthcare: An epidemiologist might be interested in knowing the number of people infected over the past years. Like in the current situation the researchers might be interested in knowing the people affected by the coronavirus over a period of time. Blood pressure traced over a period of time can be used in evaluating a drug.
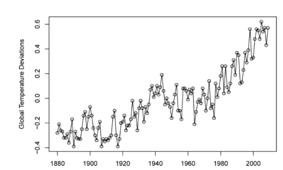
- Environmental Science: Environmental time series data can help us explain the rise in temperature over the past few years. Plot shows the temperature data over a period of time
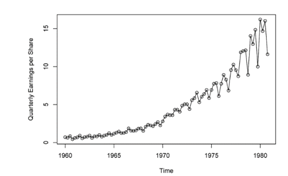
- Sales forecasting: Understanding the sales number forecasting, the company’s performance. The plot shows an earning with respect to time.
Time Series Analysis is needed to predict the future based on past data values which are mostly dependent on time. It is used by researchers and executives to predict sales, price, policies, and production.
Why we need the Time Series Analysis?
Time series data collected over different points in time breach the assumption of the conventional statistical model as correlation exists between the adjacent data points. This characteristic of the time series data breaches is one of the major assumptions that the adjacent data points are independent and identically distributed. This gives rise to the need of a systematic approach to study the time series data which can help us answer the statistical and mathematical questions that come into the picture due to the time correlation that exists.
Time series analysis holds a wide range of applications is it statistics, economics, geography, bioinformatics, neuroscience. The common link between all of them is to come up with a sophisticated technique that can be used to model data over a given period of time where the neighboring information is dependent.
In time series, Time is the independent variable and the goal is forecasting.
Some of the main reasons for carrying out time series analysis can be concluded below:
- Features: To interpret features. Features like Trend (increasing or decreasing), Seasonality (cyclic pattern) & variability (Heteroscedasticity)
- Forecasting: This is one of the most significant reasons for carrying out Time series analysis. For Example, Time series can help us predict the Stock Price. As we would not only be interested in knowing if the price will increase or decrease but also the amount by which it will increase or decrease.
- Inferences: As we all know it is difficult to predict the exact future. So the predicted value along with the margin of error (uncertainty) can be treated as a better outcome. And with the help of time series analysis, we can draw the inference like confidence interval & hypothesis test on model parameters
Conclusion
The primitive decisions were made on the basis of gut feelings and common sense. A systematic and collaborative approach to make a decision supported by the data is a real game-changer. With a wide range of applications. It has become one of the most important areas of study. It plays a crucial role in understanding the underlying structure of the time series data with aid in extracting meaningful statistical & characteristic information and henceforth the decision making backed by the data.
Recommended Articles
This is a guide to Time Series Analysis. Here we discuss the Introduction and what is Time Series Analysis and why we need it along with its Importance. You can also go through our suggested articles to learn more –

